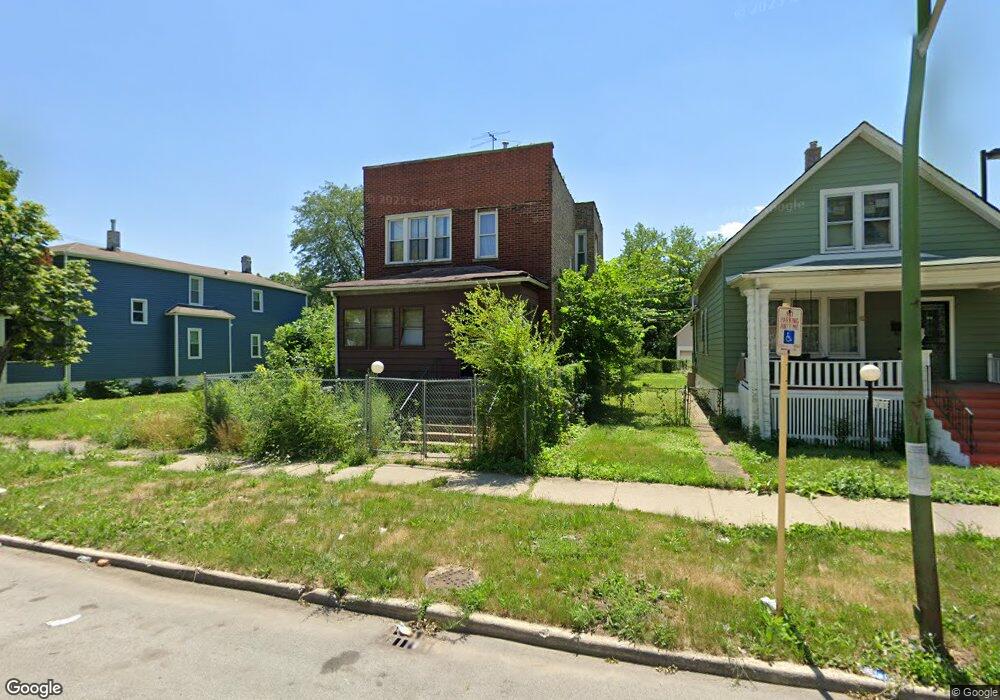
27 E 117th St Chicago, IL 60628
West Pullman NeighborhoodEstimated Value: $195,000 - $199,505
4
Beds
2
Baths
1,621
Sq Ft
$121/Sq Ft
Est. Value
About This Home
This home is located at 27 E 117th St, Chicago, IL 60628 and is currently estimated at $196,876, approximately $121 per square foot. 27 E 117th St is a home located in Cook County with nearby schools including Curtis Elementary School, Corliss High School, and Chicago Collegiate Charter School.
Ownership History
Date
Name
Owned For
Owner Type
Purchase Details
Closed on
Jan 27, 2020
Sold by
Illinois Land Investment Inc
Bought by
Tapia Martha and Tapia Abraham
Current Estimated Value
Purchase Details
Closed on
Jun 1, 2016
Sold by
Ward James
Bought by
Illinois Land Investment Inc
Purchase Details
Closed on
Feb 2, 2009
Sold by
Indymac Federal Bank Fsb
Bought by
Ward James
Purchase Details
Closed on
Jan 16, 2008
Sold by
Barrett
Bought by
Indymac Bank Fsb
Purchase Details
Closed on
Jan 13, 2006
Sold by
Mosby Eliot
Bought by
Barrett Thomas and Barrett Heather
Home Financials for this Owner
Home Financials are based on the most recent Mortgage that was taken out on this home.
Original Mortgage
$108,000
Interest Rate
6.34%
Mortgage Type
Fannie Mae Freddie Mac
Purchase Details
Closed on
Feb 4, 2004
Sold by
Chicago Title Land Trust Co
Bought by
Mosby Eliot
Home Financials for this Owner
Home Financials are based on the most recent Mortgage that was taken out on this home.
Original Mortgage
$89,000
Interest Rate
5.96%
Mortgage Type
Unknown
Purchase Details
Closed on
Apr 16, 2003
Sold by
St Francisville Llc
Bought by
Fifth Third Bank & Trust and Trust #16514
Purchase Details
Closed on
Apr 7, 2003
Sold by
Razzaq Zakkiya
Bought by
Mortgage Electronic Registration Systems and St Francisville
Purchase Details
Closed on
Dec 12, 2000
Sold by
Crawford Randy
Bought by
Razaaq Zakkiyya
Home Financials for this Owner
Home Financials are based on the most recent Mortgage that was taken out on this home.
Original Mortgage
$83,332
Interest Rate
13.2%
Purchase Details
Closed on
Oct 25, 2000
Sold by
Hud
Bought by
Crawford Randy
Home Financials for this Owner
Home Financials are based on the most recent Mortgage that was taken out on this home.
Original Mortgage
$83,332
Interest Rate
13.2%
Purchase Details
Closed on
Feb 27, 1996
Sold by
Southwest Financial Bank & Trust Company
Bought by
Arrington Lenora
Home Financials for this Owner
Home Financials are based on the most recent Mortgage that was taken out on this home.
Original Mortgage
$57,800
Interest Rate
7.07%
Mortgage Type
FHA
Purchase Details
Closed on
Jul 13, 1995
Sold by
New Vision Social Service Agency
Bought by
Southwest Financial Bank & Trust Company
Home Financials for this Owner
Home Financials are based on the most recent Mortgage that was taken out on this home.
Original Mortgage
$33,700
Interest Rate
7.59%
Create a Home Valuation Report for This Property
The Home Valuation Report is an in-depth analysis detailing your home's value as well as a comparison with similar homes in the area
Home Values in the Area
Average Home Value in this Area
Purchase History
| Date | Buyer | Sale Price | Title Company |
|---|---|---|---|
| Tapia Martha | $30,000 | None Available | |
| Illinois Land Investment Inc | $10,500 | None Available | |
| Ward James | $1,500 | Ticor Title Insurance Compan | |
| Indymac Federal Bank Fsb | -- | Ticor Title Insurance Compan | |
| Indymac Bank Fsb | -- | None Available | |
| Barrett Thomas | $135,000 | Multiple | |
| Mosby Eliot | $89,000 | Git | |
| Fifth Third Bank & Trust | $44,000 | -- | |
| Fifth Third Bank & Trust | $44,000 | -- | |
| Mortgage Electronic Registration Systems | -- | -- | |
| Mortgage Electronic Registration Systems | -- | -- | |
| Razaaq Zakkiyya | $86,000 | Stewart Title | |
| Crawford Randy | -- | -- | |
| Arrington Lenora | $58,000 | -- | |
| Southwest Financial Bank & Trust Company | -- | -- |
Source: Public Records
Mortgage History
| Date | Status | Borrower | Loan Amount |
|---|---|---|---|
| Previous Owner | Barrett Thomas | $108,000 | |
| Previous Owner | Mosby Eliot | $89,000 | |
| Previous Owner | Razaaq Zakkiyya | $83,332 | |
| Previous Owner | Arrington Lenora | $57,800 | |
| Previous Owner | Southwest Financial Bank & Trust Company | $33,700 |
Source: Public Records
Tax History
| Year | Tax Paid | Tax Assessment Tax Assessment Total Assessment is a certain percentage of the fair market value that is determined by local assessors to be the total taxable value of land and additions on the property. | Land | Improvement |
|---|---|---|---|---|
| 2025 | $838 | $6,500 | $1,830 | $4,670 |
| 2024 | $838 | $6,500 | $1,830 | $4,670 |
| 2023 | $817 | $3,963 | $2,898 | $1,065 |
| 2022 | $817 | $3,963 | $2,898 | $1,065 |
| 2021 | $799 | $3,961 | $2,897 | $1,064 |
| 2020 | $2,285 | $10,232 | $1,982 | $8,250 |
| 2019 | $2,290 | $11,369 | $1,982 | $9,387 |
| 2018 | $2,251 | $11,369 | $1,982 | $9,387 |
| 2017 | $2,114 | $9,797 | $1,830 | $7,967 |
| 2016 | $1,967 | $9,797 | $1,830 | $7,967 |
| 2015 | $1,800 | $9,797 | $1,830 | $7,967 |
| 2014 | $1,869 | $10,046 | $1,525 | $8,521 |
| 2013 | $1,831 | $10,046 | $1,525 | $8,521 |
Source: Public Records
Map
Nearby Homes
- 25 E 117th Place
- 11611 S Michigan Ave
- 11709 S Lafayette Ave
- 11576 S State St
- 119 E 118th St
- 11581 S Lafayette Ave
- 16 E 118th Place
- 140 E 118th St
- 11825 S State St
- 129 E Kensington Ave
- 11548 S State St
- 11541 S Lafayette Ave
- 11739 S Indiana Ave
- 11854 S Lafayette Ave
- 11845 S Perry Ave
- 11577 S La Salle St
- 11833 S Indiana Ave
- 143 E 119th St
- 11576 S La Salle St
- 11715 S Wentworth Ave
- 27 E 117th St Unit 1
- 23 E 117th St
- 31 E 117th St
- 35 E 117th St
- 35 E 117th St
- 26 E 117th Place
- 11708 S Michigan Ave
- 34 E 117th Place
- 36 E 117th Place
- 30 E 117th Place
- 24 E 117th St
- 32 E 117th St
- 20 E 117th St
- 34 E 117th St
- 11700 S Michigan Ave
- 16 E 117th Place
- 11626 S Michigan Ave
- 11626 S Michigan Ave
- 11623 S Michigan Ave
- 11623 S Michigan Ave
Your Personal Tour Guide
Ask me questions while you tour the home.