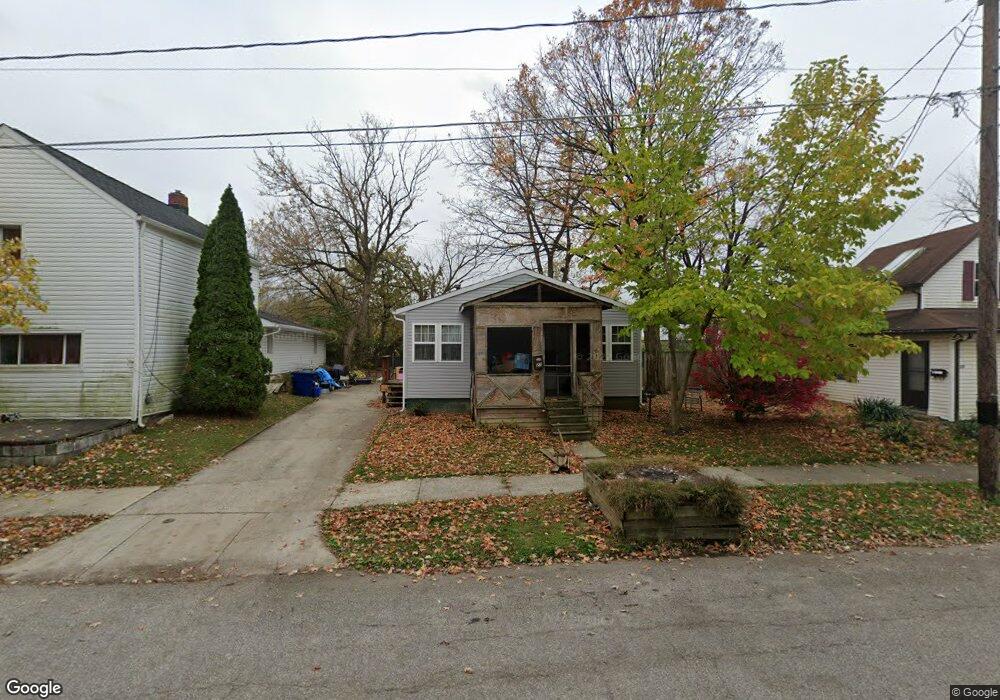
27 Eaton St Delaware, OH 43015
Estimated Value: $160,000 - $221,000
3
Beds
1
Bath
1,008
Sq Ft
$181/Sq Ft
Est. Value
About This Home
This home is located at 27 Eaton St, Delaware, OH 43015 and is currently estimated at $182,009, approximately $180 per square foot. 27 Eaton St is a home located in Delaware County with nearby schools including Laura Woodward Elementary School, John C. Dempsey Middle School, and Rutherford B. Hayes High School.
Ownership History
Date
Name
Owned For
Owner Type
Purchase Details
Closed on
Oct 7, 2021
Sold by
Mitchell Carmella and Mitchell Theodore S
Bought by
Luo Stanley
Current Estimated Value
Home Financials for this Owner
Home Financials are based on the most recent Mortgage that was taken out on this home.
Original Mortgage
$94,000
Interest Rate
3.14%
Mortgage Type
Future Advance Clause Open End Mortgage
Purchase Details
Closed on
Jul 27, 2004
Sold by
Mitchell Beulah F and Mitchell Beulah
Bought by
Mitchell Beulah F
Purchase Details
Closed on
Oct 17, 2003
Sold by
Mitchell Theodore Scott and Mitchell Carmella Denise
Bought by
Mitchell Beulah
Home Financials for this Owner
Home Financials are based on the most recent Mortgage that was taken out on this home.
Original Mortgage
$53,500
Interest Rate
6.49%
Mortgage Type
Purchase Money Mortgage
Create a Home Valuation Report for This Property
The Home Valuation Report is an in-depth analysis detailing your home's value as well as a comparison with similar homes in the area
Home Values in the Area
Average Home Value in this Area
Purchase History
| Date | Buyer | Sale Price | Title Company |
|---|---|---|---|
| Luo Stanley | $117,500 | Northwest Title Box | |
| Mitchell Beulah F | -- | None Available | |
| Mitchell Beulah | $51,000 | Chicago Title |
Source: Public Records
Mortgage History
| Date | Status | Borrower | Loan Amount |
|---|---|---|---|
| Previous Owner | Luo Stanley | $94,000 | |
| Previous Owner | Mitchell Beulah | $53,500 |
Source: Public Records
Tax History Compared to Growth
Tax History
| Year | Tax Paid | Tax Assessment Tax Assessment Total Assessment is a certain percentage of the fair market value that is determined by local assessors to be the total taxable value of land and additions on the property. | Land | Improvement |
|---|---|---|---|---|
| 2024 | $1,621 | $34,340 | $7,980 | $26,360 |
| 2023 | $1,624 | $34,340 | $7,980 | $26,360 |
| 2022 | $1,620 | $29,720 | $6,650 | $23,070 |
| 2021 | $1,695 | $29,720 | $6,650 | $23,070 |
| 2020 | $1,716 | $29,720 | $6,650 | $23,070 |
| 2019 | $1,489 | $23,950 | $5,780 | $18,170 |
| 2018 | $1,510 | $23,950 | $5,780 | $18,170 |
| 2017 | $1,495 | $21,780 | $5,010 | $16,770 |
| 2016 | $1,253 | $21,780 | $5,010 | $16,770 |
| 2015 | $1,260 | $21,780 | $5,010 | $16,770 |
| 2014 | $1,280 | $21,780 | $5,010 | $16,770 |
| 2013 | $1,351 | $22,860 | $5,010 | $17,850 |
Source: Public Records
Map
Nearby Homes
- 61 Eaton St
- 25 David St
- 168 London Rd
- 184 S Franklin St
- 41 Bernard Ave
- 297 W William St
- 312 W William St
- 71 Allenhurst Way
- 54 Allenhurst Way
- 167 W Central Ave
- 40 W Winter St
- 0 S Sandusky St Unit 224007383
- 50 Perkins Ave
- 448 W William St
- 72 Colfret Ct
- 4 Mason Ct
- 0 South St
- 86 Belle Ave
- 263 N Franklin St
- 177 Richards Dr