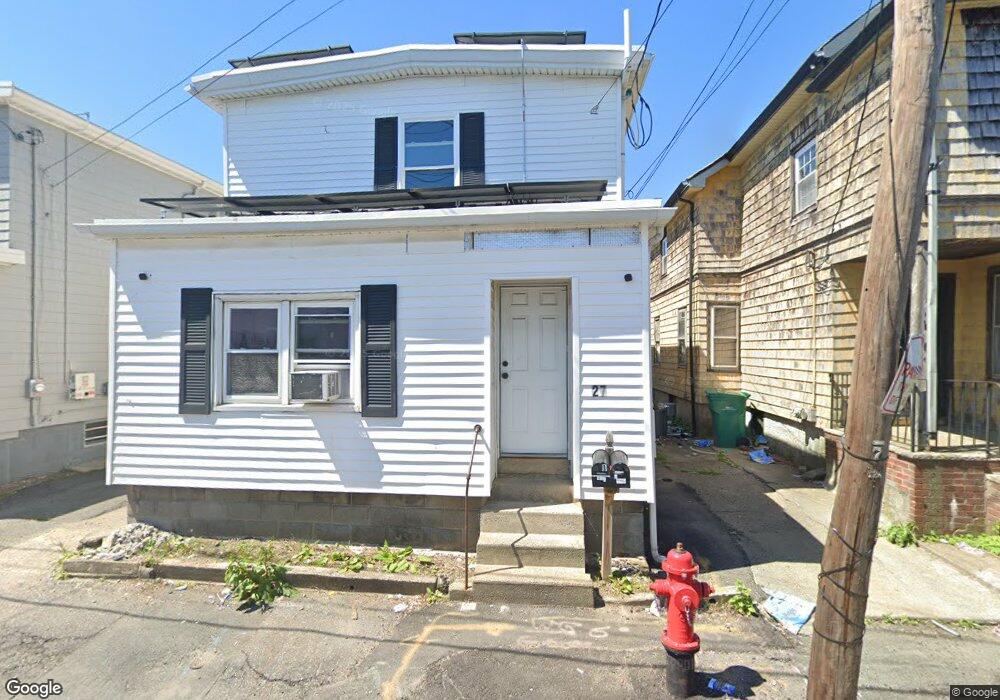
27 Edwards Ct Unit 2 Lynn, MA 01905
West Lynn NeighborhoodEstimated Value: $581,046 - $767,000
2
Beds
1
Bath
779
Sq Ft
$865/Sq Ft
Est. Value
About This Home
This home is located at 27 Edwards Ct Unit 2, Lynn, MA 01905 and is currently estimated at $673,512, approximately $864 per square foot. 27 Edwards Ct Unit 2 is a home located in Essex County with nearby schools including Drewicz Elementary School, William R. Fallon School, and Fecteau-Leary Junior/Senior High School.
Ownership History
Date
Name
Owned For
Owner Type
Purchase Details
Closed on
Aug 5, 2020
Sold by
Matos Illuminada and Matos Pradys
Bought by
Garcia-Umanzor Keyla and Umanzor-Decole Corina
Current Estimated Value
Home Financials for this Owner
Home Financials are based on the most recent Mortgage that was taken out on this home.
Original Mortgage
$540,038
Interest Rate
2.8%
Mortgage Type
FHA
Purchase Details
Closed on
Jul 1, 2002
Sold by
Anderson Gail E and Anderson Donald
Bought by
Matos Pradys and Matos Illuminada
Home Financials for this Owner
Home Financials are based on the most recent Mortgage that was taken out on this home.
Original Mortgage
$241,200
Interest Rate
6.92%
Mortgage Type
Purchase Money Mortgage
Purchase Details
Closed on
Mar 31, 1987
Sold by
Guanci Lena J
Bought by
Anderson Donald
Create a Home Valuation Report for This Property
The Home Valuation Report is an in-depth analysis detailing your home's value as well as a comparison with similar homes in the area
Home Values in the Area
Average Home Value in this Area
Purchase History
| Date | Buyer | Sale Price | Title Company |
|---|---|---|---|
| Garcia-Umanzor Keyla | $550,000 | None Available | |
| Garcia-Umanzor Keyla | $550,000 | None Available | |
| Garcia-Umanzor Keyla | $550,000 | None Available | |
| Matos Pradys | $245,000 | -- | |
| Matos Pradys | $245,000 | -- | |
| Anderson Donald | $125,000 | -- |
Source: Public Records
Mortgage History
| Date | Status | Borrower | Loan Amount |
|---|---|---|---|
| Previous Owner | Garcia-Umanzor Keyla | $540,038 | |
| Previous Owner | Anderson Donald | $260,000 | |
| Previous Owner | Anderson Donald | $241,200 |
Source: Public Records
Tax History
| Year | Tax Paid | Tax Assessment Tax Assessment Total Assessment is a certain percentage of the fair market value that is determined by local assessors to be the total taxable value of land and additions on the property. | Land | Improvement |
|---|---|---|---|---|
| 2025 | $6,102 | $589,017 | $179,400 | $409,617 |
| 2024 | $5,728 | $544,000 | $164,800 | $379,200 |
| 2023 | $5,569 | $499,500 | $146,800 | $352,700 |
| 2022 | $5,871 | $472,300 | $145,200 | $327,100 |
| 2021 | $5,044 | $387,100 | $107,800 | $279,300 |
| 2020 | $4,293 | $320,400 | $90,000 | $230,400 |
| 2019 | $4,064 | $284,200 | $77,300 | $206,900 |
| 2018 | $3,928 | $259,300 | $84,600 | $174,700 |
| 2017 | $3,834 | $245,800 | $83,100 | $162,700 |
| 2016 | $3,472 | $214,600 | $70,800 | $143,800 |
| 2015 | $3,218 | $192,100 | $64,400 | $127,700 |
Source: Public Records
Map
Nearby Homes
- 45 Cottage St Unit 3
- 6 Morris St
- 117 South St
- 20 Murray St
- 24 Hathaway St
- 78-80 Spencer St
- 95 Oakville St
- 73 Waterhill St
- 101 Commercial St
- 79 Laurel St
- 28 Wyman St
- 11 Margin St Unit 7
- 50-50A Kirtland St
- 46 Wilfred St
- 70 Wyman St
- 66 Harwood St
- 43 Baker St
- 16 Salem St
- 274 Boston St
- 50 S Common St Unit 508
- 27 Edwards Ct
- 25 Edwards Ct
- 29 Edwards Ct
- 21 Edwards Ct
- 18 Walden St
- 51 Edwards Ct
- 16 Walden St
- 16 Walden St Unit 1
- 14 Walden St
- 22 Walden St
- 16 Edwards Ct
- 22 Edwards Ct
- 12 Chadwell Ct
- 45 Edwards Ct
- 57-59 Edwards Ct Unit 3
- 57 Edwards Ct Unit 59
- 15 Edwards Ct
- 77 Edwards Ct Unit 3
- 37 Edwards Ct
- 30 Walden St
Your Personal Tour Guide
Ask me questions while you tour the home.