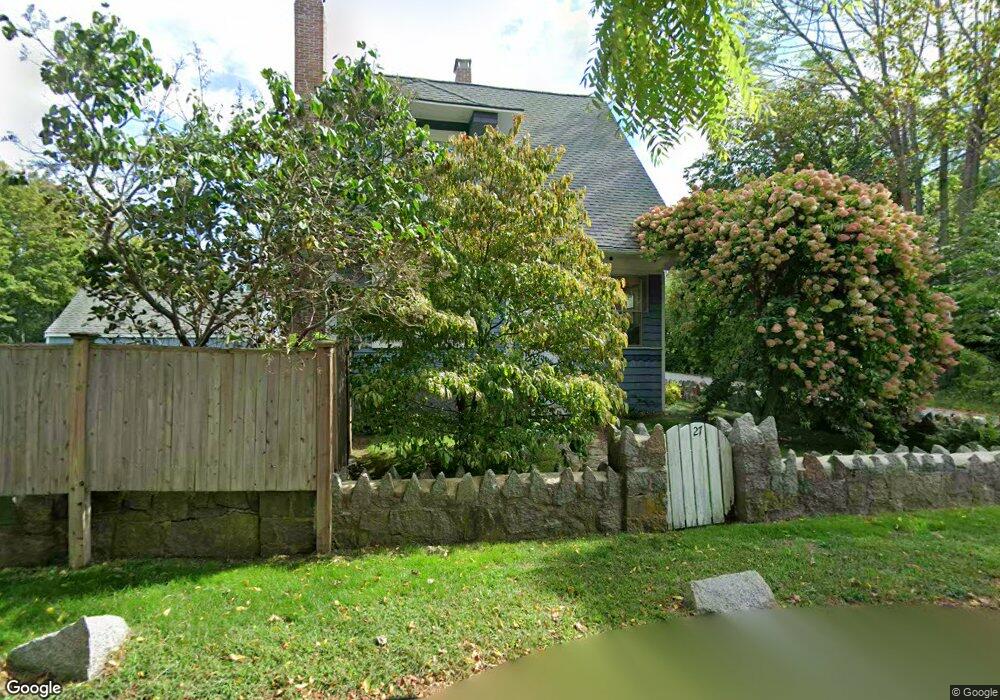
27 High St Gloucester, MA 01930
Estimated Value: $672,000 - $919,000
3
Beds
2
Baths
1,237
Sq Ft
$630/Sq Ft
Est. Value
About This Home
This home is located at 27 High St, Gloucester, MA 01930 and is currently estimated at $779,370, approximately $630 per square foot. 27 High St is a home located in Essex County with nearby schools including Plum Cove School, Ralph B O'maley Middle School, and Gloucester High School.
Ownership History
Date
Name
Owned For
Owner Type
Purchase Details
Closed on
Sep 1, 2004
Sold by
Clayton Brett A and Clayton Shawn
Bought by
Ward Jeffrey B and Ward Kristen D
Current Estimated Value
Home Financials for this Owner
Home Financials are based on the most recent Mortgage that was taken out on this home.
Original Mortgage
$287,200
Interest Rate
6.01%
Mortgage Type
Purchase Money Mortgage
Create a Home Valuation Report for This Property
The Home Valuation Report is an in-depth analysis detailing your home's value as well as a comparison with similar homes in the area
Purchase History
| Date | Buyer | Sale Price | Title Company |
|---|---|---|---|
| Ward Jeffrey B | $359,000 | -- |
Source: Public Records
Mortgage History
| Date | Status | Borrower | Loan Amount |
|---|---|---|---|
| Open | Ward Jeffrey B | $315,000 | |
| Closed | Ward Jeffrey B | $317,500 | |
| Closed | Ward Jeffrey B | $287,200 | |
| Closed | Ward Jeffrey B | $53,850 |
Source: Public Records
Tax History
| Year | Tax Paid | Tax Assessment Tax Assessment Total Assessment is a certain percentage of the fair market value that is determined by local assessors to be the total taxable value of land and additions on the property. | Land | Improvement |
|---|---|---|---|---|
| 2025 | $5,604 | $576,500 | $242,000 | $334,500 |
| 2024 | $5,497 | $565,000 | $230,500 | $334,500 |
| 2023 | $5,225 | $493,400 | $205,800 | $287,600 |
| 2022 | $5,026 | $428,500 | $175,000 | $253,500 |
| 2021 | $4,863 | $390,900 | $159,100 | $231,800 |
| 2020 | $4,759 | $386,000 | $159,100 | $226,900 |
| 2019 | $4,581 | $361,000 | $159,100 | $201,900 |
| 2018 | $4,429 | $342,500 | $159,100 | $183,400 |
| 2017 | $4,301 | $326,100 | $151,500 | $174,600 |
| 2016 | $4,186 | $307,600 | $152,000 | $155,600 |
| 2015 | $4,049 | $296,600 | $152,000 | $144,600 |
Source: Public Records
Map
Nearby Homes
- 9 Hickory St
- 43 High St Unit B
- 1030 Washington St
- 5 Viking St Unit A
- 7 Colburn St
- 4 Ciaramitaro Ct
- 22 Woodbury St
- 136 Leonard St
- 14 1/2 Story St Unit B
- 94 Phillips Ave
- 13 Phillips Ave
- 165 Granite St
- 33 Quarry Ridge Ln Unit 33
- 5 Boulder Top
- 32 Haven Ave
- 672 Washington St
- 13 Rowe Point
- 3 Vine Ave
- 5 Smith St Unit R
- 15 Beach St
Your Personal Tour Guide
Ask me questions while you tour the home.