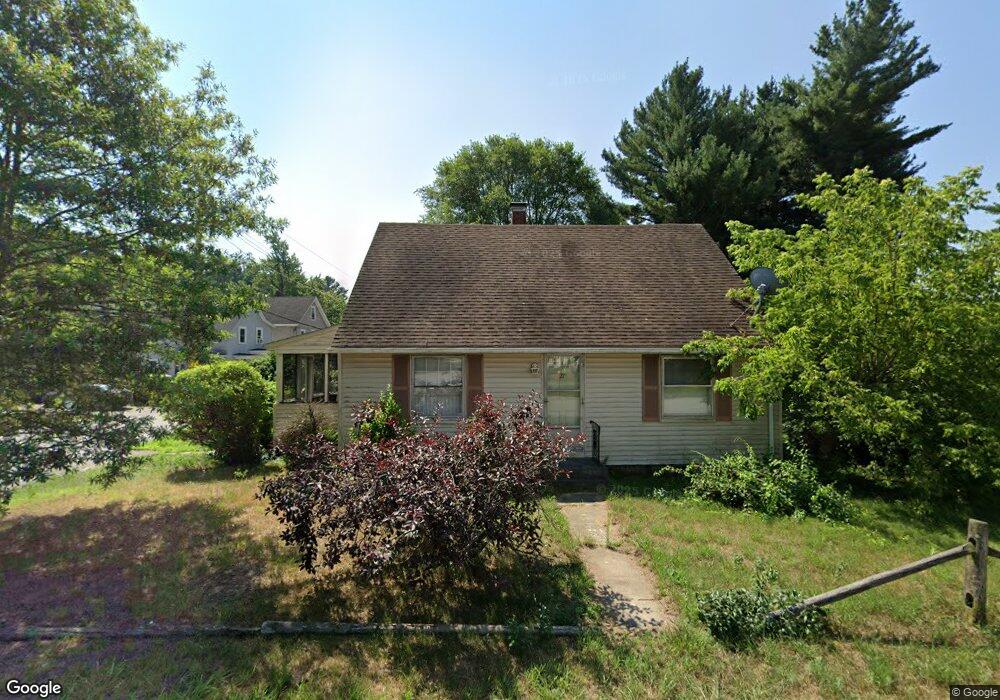
27 Lovell St Nashua, NH 03060
South End Nashua NeighborhoodEstimated Value: $444,000 - $516,000
2
Beds
2
Baths
1,418
Sq Ft
$329/Sq Ft
Est. Value
About This Home
This home is located at 27 Lovell St, Nashua, NH 03060 and is currently estimated at $466,078, approximately $328 per square foot. 27 Lovell St is a home located in Hillsborough County with nearby schools including Fairgrounds Elementary School, Elm Street Middle School, and Nashua High School South.
Ownership History
Date
Name
Owned For
Owner Type
Purchase Details
Closed on
Aug 16, 2000
Sold by
Ethel M Gage Est
Bought by
Falardeau Alex C
Current Estimated Value
Home Financials for this Owner
Home Financials are based on the most recent Mortgage that was taken out on this home.
Original Mortgage
$124,400
Interest Rate
8.13%
Create a Home Valuation Report for This Property
The Home Valuation Report is an in-depth analysis detailing your home's value as well as a comparison with similar homes in the area
Home Values in the Area
Average Home Value in this Area
Purchase History
| Date | Buyer | Sale Price | Title Company |
|---|---|---|---|
| Falardeau Alex C | $132,000 | -- |
Source: Public Records
Mortgage History
| Date | Status | Borrower | Loan Amount |
|---|---|---|---|
| Open | Falardeau Alex C | $65,000 | |
| Open | Falardeau Alex C | $164,000 | |
| Closed | Falardeau Alex C | $163,567 | |
| Closed | Falardeau Alex C | $124,400 |
Source: Public Records
Tax History Compared to Growth
Tax History
| Year | Tax Paid | Tax Assessment Tax Assessment Total Assessment is a certain percentage of the fair market value that is determined by local assessors to be the total taxable value of land and additions on the property. | Land | Improvement |
|---|---|---|---|---|
| 2023 | $5,721 | $313,800 | $115,500 | $198,300 |
| 2022 | $5,670 | $313,800 | $115,500 | $198,300 |
| 2021 | $4,960 | $213,600 | $77,000 | $136,600 |
| 2020 | $5,880 | $212,000 | $77,000 | $135,000 |
| 2019 | $4,613 | $212,000 | $77,000 | $135,000 |
| 2018 | $0 | $212,000 | $77,000 | $135,000 |
| 2017 | $4,289 | $166,300 | $74,400 | $91,900 |
| 2016 | $5,320 | $166,300 | $74,400 | $91,900 |
| 2015 | $4,079 | $166,300 | $74,400 | $91,900 |
| 2014 | $4,000 | $166,300 | $74,400 | $91,900 |
Source: Public Records
Map
Nearby Homes
- 15 Lovell St Unit 20
- 15 Lovell St Unit 10
- 8 Nevada St
- 121 Palm St
- 4 Fulton St
- 22 Gilman St
- 29 Wilder St
- 70 Linwood St
- 71 Vine St Unit 713/4
- 24 E Otterson St
- 27 Beech St Unit 54
- 30 Blanchard St
- 1 Hayden St
- 38 Central St
- 4 Haines St Unit 56
- 4 1/2 Haines St
- 12 Harris St Unit 68
- 35-41 E Hollis St
- 20 Morse Ave
- 18 Harbor Ave Unit 103