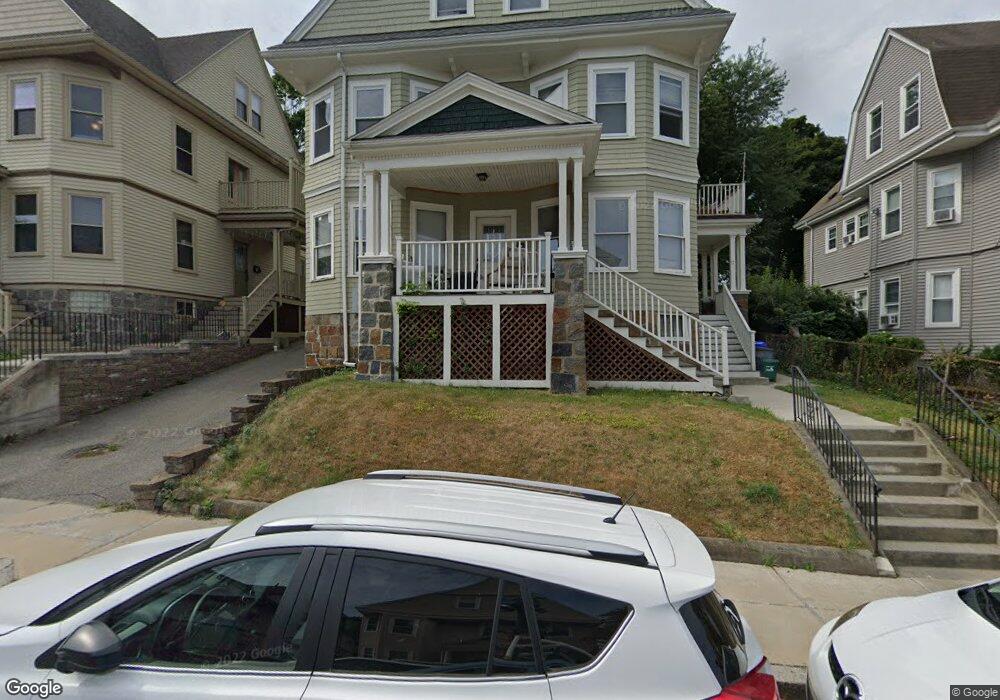
27 Mapleton St Unit 29 Brighton, MA 02135
Brighton NeighborhoodEstimated Value: $1,389,000 - $1,792,000
7
Beds
3
Baths
3,560
Sq Ft
$444/Sq Ft
Est. Value
About This Home
This home is located at 27 Mapleton St Unit 29, Brighton, MA 02135 and is currently estimated at $1,581,583, approximately $444 per square foot. 27 Mapleton St Unit 29 is a home located in Suffolk County with nearby schools including Boston Green Academy Horace Mann Charter School, St Columbkille Partnership School, and Shaloh House Jewish Day School.
Ownership History
Date
Name
Owned For
Owner Type
Purchase Details
Closed on
Mar 28, 2018
Sold by
Keane Brian F and Keane Tara M
Bought by
27-33 Mapleton Street
Current Estimated Value
Home Financials for this Owner
Home Financials are based on the most recent Mortgage that was taken out on this home.
Original Mortgage
$1,400,000
Outstanding Balance
$1,202,294
Interest Rate
4.38%
Mortgage Type
Commercial
Estimated Equity
$379,289
Purchase Details
Closed on
Jul 30, 2004
Sold by
Lau Albert K
Bought by
Keane Brian and Keane Brian F
Home Financials for this Owner
Home Financials are based on the most recent Mortgage that was taken out on this home.
Original Mortgage
$500,000
Interest Rate
6.33%
Mortgage Type
Purchase Money Mortgage
Purchase Details
Closed on
Feb 6, 1987
Sold by
Wong Irene Y
Bought by
Lau Albert K
Create a Home Valuation Report for This Property
The Home Valuation Report is an in-depth analysis detailing your home's value as well as a comparison with similar homes in the area
Home Values in the Area
Average Home Value in this Area
Purchase History
| Date | Buyer | Sale Price | Title Company |
|---|---|---|---|
| 27-33 Mapleton Street | -- | -- | |
| Keane Brian | $640,000 | -- | |
| Lau Albert K | $9,000 | -- |
Source: Public Records
Mortgage History
| Date | Status | Borrower | Loan Amount |
|---|---|---|---|
| Open | 27-33 Mapleton Street | $1,400,000 | |
| Previous Owner | Lau Albert K | $500,000 | |
| Previous Owner | Lau Albert K | $76,000 | |
| Previous Owner | Lau Albert K | $129,000 |
Source: Public Records
Tax History
| Year | Tax Paid | Tax Assessment Tax Assessment Total Assessment is a certain percentage of the fair market value that is determined by local assessors to be the total taxable value of land and additions on the property. | Land | Improvement |
|---|---|---|---|---|
| 2025 | $15,766 | $1,361,500 | $478,400 | $883,100 |
| 2024 | $14,372 | $1,318,500 | $369,600 | $948,900 |
| 2023 | $14,161 | $1,318,500 | $369,600 | $948,900 |
| 2022 | $13,400 | $1,231,600 | $345,200 | $886,400 |
| 2021 | $12,516 | $1,173,000 | $328,800 | $844,200 |
| 2020 | $11,907 | $1,127,600 | $302,100 | $825,500 |
| 2019 | $11,315 | $1,073,500 | $237,300 | $836,200 |
| 2018 | $10,415 | $993,800 | $237,300 | $756,500 |
| 2017 | $10,318 | $974,300 | $237,300 | $737,000 |
| 2016 | $9,743 | $885,700 | $237,300 | $648,400 |
| 2015 | $8,678 | $716,600 | $187,900 | $528,700 |
| 2014 | $7,714 | $613,200 | $187,900 | $425,300 |
Source: Public Records
Map
Nearby Homes
- 36-38 Mapleton St
- 354 Market St Unit 9
- 87 Etna St
- 14 Bennett St
- 7 Cypress Rd Unit 703
- 41-43 Arlington St
- 15 17 Cushman St
- 6 Cypress Rd Unit 606
- 214 Market St Unit 201
- 11 Faneuil St
- 58 Dustin St Unit 1
- 200-202 Market St
- 254-256 Washington St
- 83-85 Surrey St
- 230 Washington St Unit 4
- 230 Washington St Unit 7
- 27 Shepard St Unit 3
- 30 Dighton St Unit 1
- 30 Dighton St Unit 4
- 191 Washington St Unit 615
- 29 Mapleton St
- 29 Mapleton St Unit 1
- 25 Mapleton St Unit 25A
- 25 Mapleton St Unit 3
- 25 Mapleton St Unit 1
- 25 Mapleton St
- 25 Mapleton St Unit 2
- 31 Mapleton St Unit 33
- 33 Mapleton St Unit 2
- 31 Mapleton St Unit 1
- 31 Mapleton St Unit 2
- 35 Mapleton St Unit 37
- 21 Sparhawk St Unit 3
- 19 Sparhawk St Unit 2
- 19 Sparhawk St Unit 1
- 21 Sparhawk St Unit 2
- 19R Sparhawk St
- 19 Mapleton St
- 21 Mapleton St
- 19 Mapleton St Unit 19
Your Personal Tour Guide
Ask me questions while you tour the home.