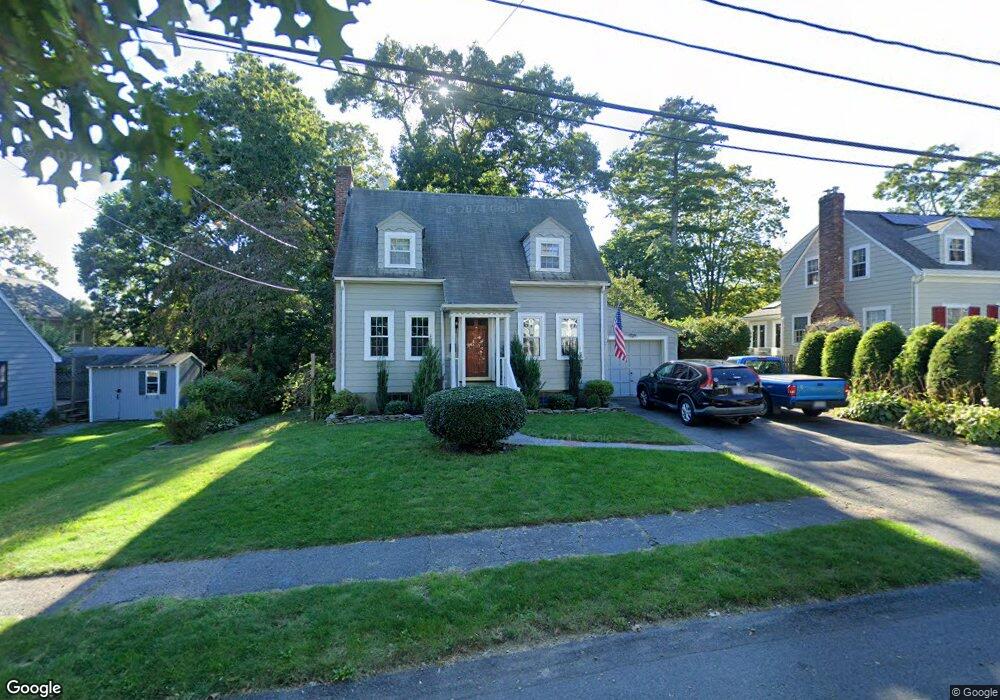
27 Morley St Needham, MA 02492
Estimated Value: $1,113,000 - $1,375,000
3
Beds
2
Baths
1,072
Sq Ft
$1,192/Sq Ft
Est. Value
About This Home
This home is located at 27 Morley St, Needham, MA 02492 and is currently estimated at $1,278,315, approximately $1,192 per square foot. 27 Morley St is a home located in Norfolk County with nearby schools including Mitchell Elementary School, High Rock Middle School, and Pollard Middle School.
Ownership History
Date
Name
Owned For
Owner Type
Purchase Details
Closed on
May 10, 1996
Sold by
Pasculano Deborah and Pasculano Mark
Bought by
Mottino Betsy M
Current Estimated Value
Home Financials for this Owner
Home Financials are based on the most recent Mortgage that was taken out on this home.
Original Mortgage
$220,500
Interest Rate
7.67%
Mortgage Type
Purchase Money Mortgage
Purchase Details
Closed on
Jan 29, 1993
Sold by
Reiter Admrx Marion
Bought by
Pasculano Deborah and Pasculano Mark
Home Financials for this Owner
Home Financials are based on the most recent Mortgage that was taken out on this home.
Original Mortgage
$154,000
Interest Rate
8.16%
Mortgage Type
Purchase Money Mortgage
Create a Home Valuation Report for This Property
The Home Valuation Report is an in-depth analysis detailing your home's value as well as a comparison with similar homes in the area
Home Values in the Area
Average Home Value in this Area
Purchase History
| Date | Buyer | Sale Price | Title Company |
|---|---|---|---|
| Mottino Betsy M | $245,000 | -- | |
| Pasculano Deborah | $200,000 | -- |
Source: Public Records
Mortgage History
| Date | Status | Borrower | Loan Amount |
|---|---|---|---|
| Open | Pasculano Deborah | $69,204 | |
| Open | Pasculano Deborah | $160,000 | |
| Closed | Pasculano Deborah | $220,500 | |
| Previous Owner | Pasculano Deborah | $154,000 |
Source: Public Records
Tax History Compared to Growth
Tax History
| Year | Tax Paid | Tax Assessment Tax Assessment Total Assessment is a certain percentage of the fair market value that is determined by local assessors to be the total taxable value of land and additions on the property. | Land | Improvement |
|---|---|---|---|---|
| 2025 | $10,816 | $1,020,400 | $783,800 | $236,600 |
| 2024 | $11,123 | $888,400 | $577,000 | $311,400 |
| 2023 | $11,274 | $864,600 | $577,000 | $287,600 |
| 2022 | $10,510 | $786,100 | $510,600 | $275,500 |
| 2021 | $10,243 | $786,100 | $510,600 | $275,500 |
| 2020 | $9,860 | $789,400 | $510,900 | $278,500 |
| 2019 | $9,128 | $736,700 | $464,400 | $272,300 |
| 2018 | $8,752 | $736,700 | $464,400 | $272,300 |
| 2017 | $8,372 | $704,100 | $464,400 | $239,700 |
| 2016 | $8,125 | $704,100 | $464,400 | $239,700 |
| 2015 | $7,949 | $704,100 | $464,400 | $239,700 |
| 2014 | $7,190 | $617,700 | $387,000 | $230,700 |
Source: Public Records
Map
Nearby Homes
- 62 Washington Ave
- 190 Brookline St
- 332 Hillcrest Rd
- 40 Otis St Unit L
- 42 Otis St Unit R
- 26 Pinewood Rd
- 556 Webster St
- 154 Warren St
- 23 Cheney St
- 71 School St
- 233 Warren St
- 247 Broad Meadow Rd
- 701 Greendale Ave
- 317 Dedham Ave
- 445 Hillside Ave
- 1011 Webster St
- 9 Jayne Rd
- 143 Hunting Rd
- 3 Crescent Rd
- 400 Hunnewell St Unit 103