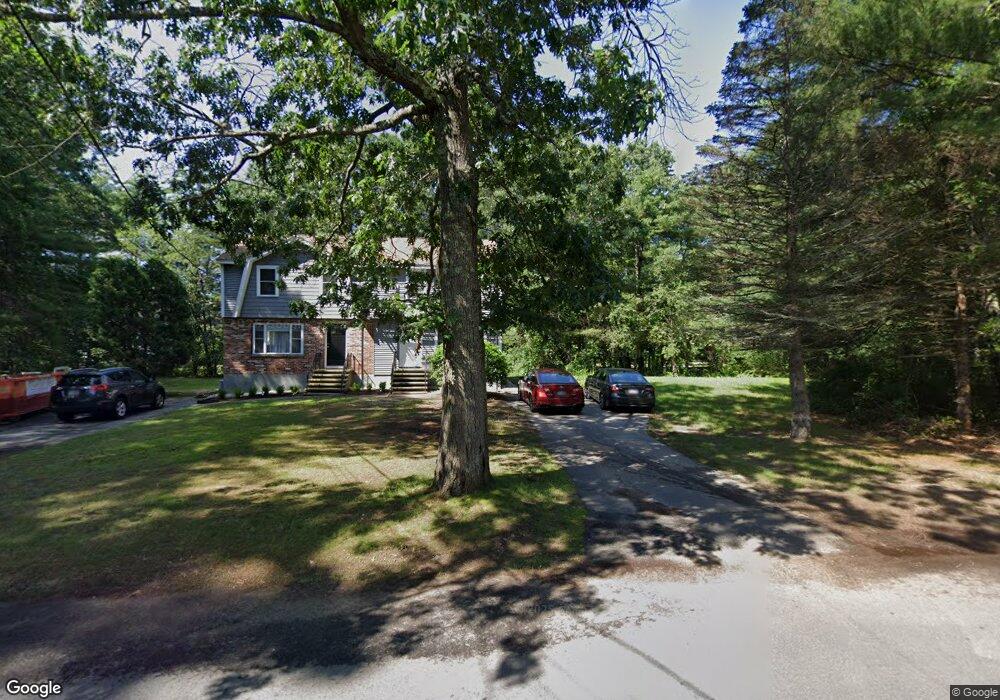
27 Parker Cir Salem, NH 03079
North Salem NeighborhoodEstimated Value: $669,189 - $746,000
4
Beds
2
Baths
2,288
Sq Ft
$306/Sq Ft
Est. Value
About This Home
This home is located at 27 Parker Cir, Salem, NH 03079 and is currently estimated at $701,063, approximately $306 per square foot. 27 Parker Cir is a home located in Rockingham County with nearby schools including North Salem Elementary School, Woodbury School, and Salem High School.
Ownership History
Date
Name
Owned For
Owner Type
Purchase Details
Closed on
Mar 31, 2022
Sold by
Dawson Linda J
Bought by
Jamieson James R
Current Estimated Value
Home Financials for this Owner
Home Financials are based on the most recent Mortgage that was taken out on this home.
Original Mortgage
$382,900
Outstanding Balance
$359,489
Interest Rate
4.67%
Mortgage Type
Purchase Money Mortgage
Estimated Equity
$341,574
Create a Home Valuation Report for This Property
The Home Valuation Report is an in-depth analysis detailing your home's value as well as a comparison with similar homes in the area
Home Values in the Area
Average Home Value in this Area
Purchase History
| Date | Buyer | Sale Price | Title Company |
|---|---|---|---|
| Jamieson James R | $547,000 | None Available | |
| Jamieson James R | $547,000 | None Available |
Source: Public Records
Mortgage History
| Date | Status | Borrower | Loan Amount |
|---|---|---|---|
| Open | Jamieson James R | $382,900 | |
| Closed | Jamieson James R | $382,900 |
Source: Public Records
Tax History Compared to Growth
Tax History
| Year | Tax Paid | Tax Assessment Tax Assessment Total Assessment is a certain percentage of the fair market value that is determined by local assessors to be the total taxable value of land and additions on the property. | Land | Improvement |
|---|---|---|---|---|
| 2024 | $8,379 | $476,100 | $182,700 | $293,400 |
| 2023 | $8,075 | $476,100 | $182,700 | $293,400 |
| 2022 | $7,099 | $442,300 | $182,700 | $259,600 |
| 2021 | $7,317 | $457,900 | $182,700 | $275,200 |
| 2020 | $7,423 | $337,100 | $130,600 | $206,500 |
| 2019 | $7,409 | $337,100 | $130,600 | $206,500 |
| 2018 | $7,094 | $337,100 | $130,600 | $206,500 |
| 2017 | $5,847 | $337,100 | $130,600 | $206,500 |
| 2016 | $6,887 | $337,100 | $130,600 | $206,500 |
| 2015 | $6,408 | $299,600 | $129,000 | $170,600 |
| 2014 | $6,229 | $299,600 | $129,000 | $170,600 |
| 2013 | $6,130 | $299,600 | $129,000 | $170,600 |
Source: Public Records
Map
Nearby Homes
- 21 Teague Dr
- 34 Shore Dr
- 27 Norwood Rd
- 16 Autumn Woods Rd
- 29 Hawk Dr
- 10 Independence Dr
- 60 Shore Dr
- 69 Caddy Dr
- 26 King St
- 84 Caddy Dr
- 114 Chases Grove Rd
- 67 & 69 Conleys Grove Rd
- 116 Chases Grove Rd
- 136 Shore Dr
- 120 Chases Grove Rd
- 117C Chases Grove Rd
- 182 Shore Dr
- 5 Betty Ln
- 35 Steele Rd
- 9 Valcat Ln