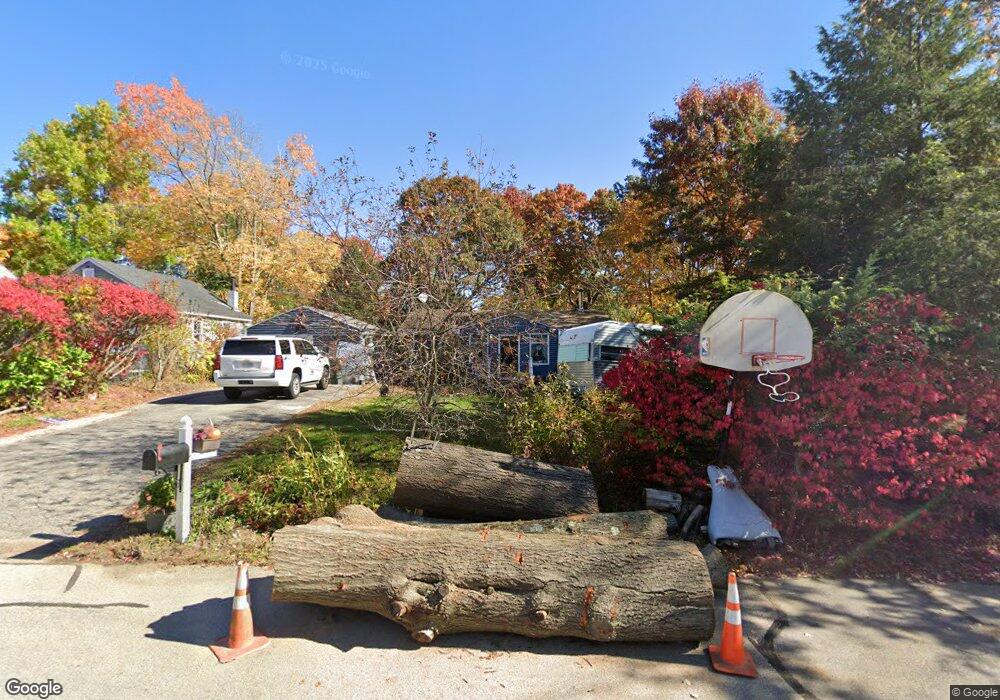
27 Poplar St Manchester, NH 03104
Estimated Value: $430,000 - $448,000
2
Beds
1
Bath
1,050
Sq Ft
$418/Sq Ft
Est. Value
About This Home
This home is located at 27 Poplar St, Manchester, NH 03104 and is currently estimated at $439,225, approximately $418 per square foot. 27 Poplar St is a home located in Hillsborough County with nearby schools including Webster School, Hillside Middle School, and Kreiva Academy Public Charter School (H).
Ownership History
Date
Name
Owned For
Owner Type
Purchase Details
Closed on
May 27, 2004
Sold by
Mcmahon Raymond J
Bought by
Cronshaw Kevin and Tracy Cronshaw M
Current Estimated Value
Home Financials for this Owner
Home Financials are based on the most recent Mortgage that was taken out on this home.
Original Mortgage
$194,829
Interest Rate
5.88%
Mortgage Type
Purchase Money Mortgage
Create a Home Valuation Report for This Property
The Home Valuation Report is an in-depth analysis detailing your home's value as well as a comparison with similar homes in the area
Home Values in the Area
Average Home Value in this Area
Purchase History
| Date | Buyer | Sale Price | Title Company |
|---|---|---|---|
| Cronshaw Kevin | $197,900 | -- |
Source: Public Records
Mortgage History
| Date | Status | Borrower | Loan Amount |
|---|---|---|---|
| Open | Cronshaw Kevin | $197,603 | |
| Closed | Cronshaw Kevin | $194,829 |
Source: Public Records
Tax History Compared to Growth
Tax History
| Year | Tax Paid | Tax Assessment Tax Assessment Total Assessment is a certain percentage of the fair market value that is determined by local assessors to be the total taxable value of land and additions on the property. | Land | Improvement |
|---|---|---|---|---|
| 2024 | $5,843 | $298,400 | $131,700 | $166,700 |
| 2023 | $5,628 | $298,400 | $131,700 | $166,700 |
| 2022 | $5,443 | $298,400 | $131,700 | $166,700 |
| 2021 | $5,276 | $298,400 | $131,700 | $166,700 |
| 2020 | $4,989 | $202,300 | $94,200 | $108,100 |
| 2019 | $4,920 | $202,300 | $94,200 | $108,100 |
| 2018 | $4,790 | $202,300 | $94,200 | $108,100 |
| 2017 | $4,718 | $202,300 | $94,200 | $108,100 |
| 2016 | $4,681 | $202,300 | $94,200 | $108,100 |
| 2015 | $4,161 | $177,500 | $80,700 | $96,800 |
| 2014 | $4,171 | $177,500 | $80,700 | $96,800 |
| 2013 | $4,024 | $177,500 | $80,700 | $96,800 |
Source: Public Records
Map
Nearby Homes