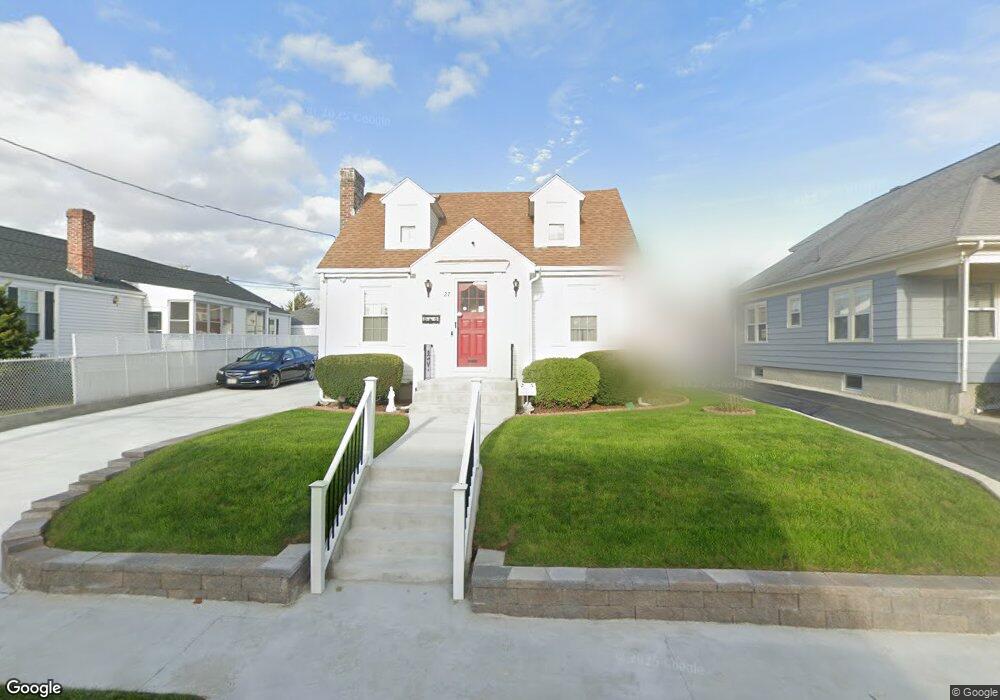
27 Riverfarm Rd Cranston, RI 02910
Forest Hills NeighborhoodEstimated Value: $376,152 - $433,000
2
Beds
2
Baths
1,355
Sq Ft
$300/Sq Ft
Est. Value
About This Home
This home is located at 27 Riverfarm Rd, Cranston, RI 02910 and is currently estimated at $407,038, approximately $300 per square foot. 27 Riverfarm Rd is a home located in Providence County with nearby schools including Woodridge Elementary School, Western Hills Middle School, and Cranston High School West.
Ownership History
Date
Name
Owned For
Owner Type
Purchase Details
Closed on
Oct 3, 2013
Sold by
Villari William J and Villari Janet M
Bought by
Santurri Robert and Santurri Susan J
Current Estimated Value
Home Financials for this Owner
Home Financials are based on the most recent Mortgage that was taken out on this home.
Original Mortgage
$127,645
Interest Rate
4.75%
Mortgage Type
FHA
Create a Home Valuation Report for This Property
The Home Valuation Report is an in-depth analysis detailing your home's value as well as a comparison with similar homes in the area
Home Values in the Area
Average Home Value in this Area
Purchase History
| Date | Buyer | Sale Price | Title Company |
|---|---|---|---|
| Santurri Robert | $130,000 | -- |
Source: Public Records
Mortgage History
| Date | Status | Borrower | Loan Amount |
|---|---|---|---|
| Closed | Santurri Robert | $125,941 | |
| Closed | Santurri Robert | $127,645 | |
| Previous Owner | Santurri Robert | $60,000 |
Source: Public Records
Tax History Compared to Growth
Tax History
| Year | Tax Paid | Tax Assessment Tax Assessment Total Assessment is a certain percentage of the fair market value that is determined by local assessors to be the total taxable value of land and additions on the property. | Land | Improvement |
|---|---|---|---|---|
| 2025 | $3,856 | $277,800 | $102,000 | $175,800 |
| 2024 | $3,781 | $277,800 | $102,000 | $175,800 |
| 2023 | $3,941 | $208,500 | $70,400 | $138,100 |
| 2022 | $3,859 | $208,500 | $70,400 | $138,100 |
| 2021 | $3,753 | $208,500 | $70,400 | $138,100 |
| 2020 | $3,737 | $179,900 | $73,700 | $106,200 |
| 2019 | $3,737 | $179,900 | $73,700 | $106,200 |
| 2018 | $3,650 | $179,900 | $73,700 | $106,200 |
| 2017 | $3,524 | $153,600 | $67,000 | $86,600 |
| 2016 | $3,448 | $153,600 | $67,000 | $86,600 |
| 2015 | $3,448 | $153,600 | $67,000 | $86,600 |
| 2014 | $3,618 | $158,400 | $67,000 | $91,400 |
Source: Public Records
Map
Nearby Homes
- 12 Stevens Rd
- 140 Concord Ave
- 55 Columbus Blvd
- 130 Wollaston St
- 46 Roslyn Ave
- 115 Norfolk St
- 51 Norfolk St
- 74 Leslie St
- 36 Blackamore Ave
- 75 High School Ave
- 63 Packard St
- 80 Packard St
- 111 Belgium St
- 210 Crescent Ave
- 1 Rolfe Square
- 140 Eldridge St
- 166 Midwood St
- 136 Frankfort St
- 0 Fiat Ave
- 41 Gleason St