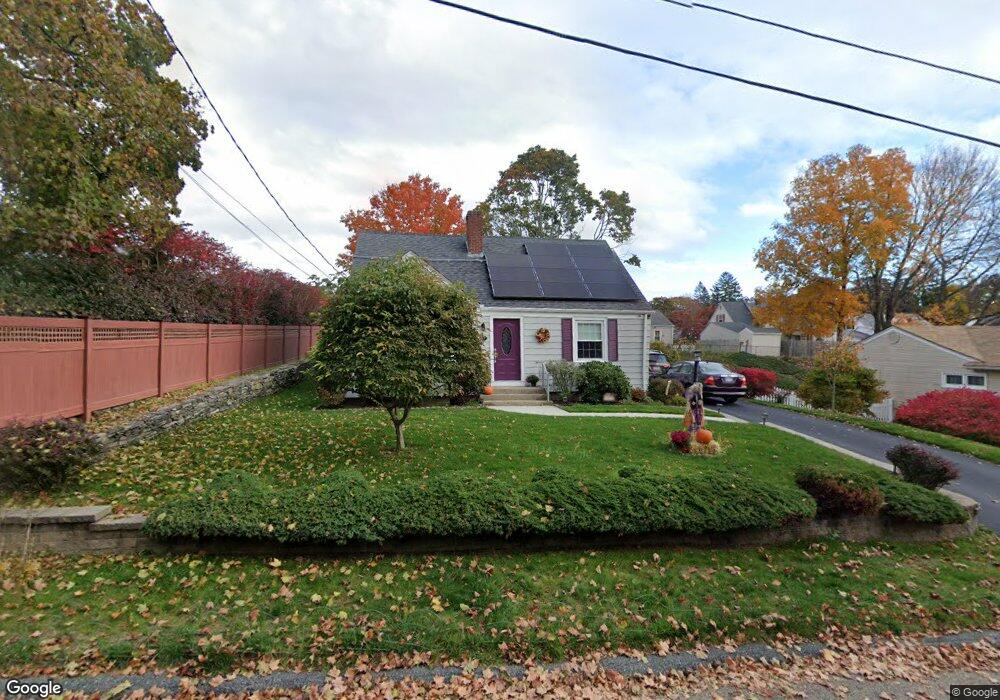
27 Roslyn Ave Cranston, RI 02910
Forest Hills NeighborhoodEstimated Value: $426,000 - $443,000
3
Beds
2
Baths
1,548
Sq Ft
$280/Sq Ft
Est. Value
About This Home
This home is located at 27 Roslyn Ave, Cranston, RI 02910 and is currently estimated at $434,109, approximately $280 per square foot. 27 Roslyn Ave is a home located in Providence County with nearby schools including Woodridge Elementary School, Western Hills Middle School, and Cranston High School West.
Ownership History
Date
Name
Owned For
Owner Type
Purchase Details
Closed on
Jun 24, 2025
Sold by
Dichiara Deborah A
Bought by
Deborah A Dichiara Relt A and Deborah Dichiara
Current Estimated Value
Purchase Details
Closed on
Dec 23, 1998
Sold by
Sangster Gary A
Bought by
Tate Deborah A
Purchase Details
Closed on
Jun 27, 1991
Sold by
Sharman Hope A
Bought by
Sangster Gary A
Create a Home Valuation Report for This Property
The Home Valuation Report is an in-depth analysis detailing your home's value as well as a comparison with similar homes in the area
Home Values in the Area
Average Home Value in this Area
Purchase History
| Date | Buyer | Sale Price | Title Company |
|---|---|---|---|
| Deborah A Dichiara Relt A | -- | None Available | |
| Deborah A Dichiara Relt A | -- | None Available | |
| Tate Deborah A | $124,000 | -- | |
| Tate Deborah A | $124,000 | -- | |
| Sangster Gary A | $103,000 | -- | |
| Sangster Gary A | $103,000 | -- |
Source: Public Records
Mortgage History
| Date | Status | Borrower | Loan Amount |
|---|---|---|---|
| Previous Owner | Sangster Gary A | $87,000 | |
| Previous Owner | Sangster Gary A | $30,000 | |
| Previous Owner | Sangster Gary A | $25,000 |
Source: Public Records
Tax History
| Year | Tax Paid | Tax Assessment Tax Assessment Total Assessment is a certain percentage of the fair market value that is determined by local assessors to be the total taxable value of land and additions on the property. | Land | Improvement |
|---|---|---|---|---|
| 2025 | $4,897 | $352,800 | $103,900 | $248,900 |
| 2024 | $4,802 | $352,800 | $103,900 | $248,900 |
| 2023 | $4,691 | $248,200 | $71,700 | $176,500 |
| 2022 | $4,594 | $248,200 | $71,700 | $176,500 |
| 2021 | $4,468 | $248,200 | $71,700 | $176,500 |
| 2020 | $4,293 | $206,700 | $75,100 | $131,600 |
| 2019 | $4,293 | $206,700 | $75,100 | $131,600 |
| 2018 | $4,194 | $206,700 | $75,100 | $131,600 |
| 2017 | $4,152 | $181,000 | $68,200 | $112,800 |
| 2016 | $4,063 | $181,000 | $68,200 | $112,800 |
| 2015 | $4,063 | $181,000 | $68,200 | $112,800 |
| 2014 | $3,780 | $165,500 | $68,200 | $97,300 |
Source: Public Records
Map
Nearby Homes
Your Personal Tour Guide
Ask me questions while you tour the home.