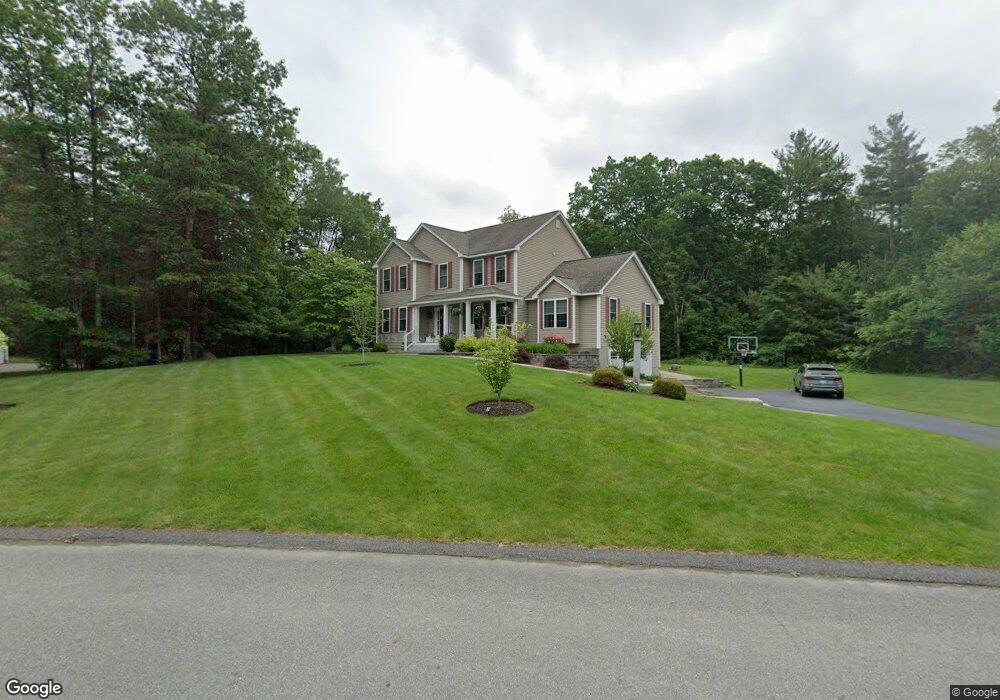
27 Tanager Way Londonderry, NH 03053
Estimated Value: $845,000 - $981,000
4
Beds
3
Baths
2,700
Sq Ft
$329/Sq Ft
Est. Value
About This Home
This home is located at 27 Tanager Way, Londonderry, NH 03053 and is currently estimated at $887,992, approximately $328 per square foot. 27 Tanager Way is a home located in Rockingham County with nearby schools including Matthew Thornton Elementary School, Londonderry Middle School, and Londonderry Senior High School.
Ownership History
Date
Name
Owned For
Owner Type
Purchase Details
Closed on
Jan 18, 2022
Sold by
Marston-Killelea Brandy and Killelea Thomas J
Bought by
Killelea Ft and Killelea
Current Estimated Value
Home Financials for this Owner
Home Financials are based on the most recent Mortgage that was taken out on this home.
Original Mortgage
$420,000
Outstanding Balance
$387,257
Interest Rate
3.45%
Mortgage Type
New Conventional
Estimated Equity
$500,735
Purchase Details
Closed on
Nov 25, 2020
Sold by
Killelea Thomas J
Bought by
Killelea Ft and Killelea
Home Financials for this Owner
Home Financials are based on the most recent Mortgage that was taken out on this home.
Original Mortgage
$399,584
Interest Rate
3.2%
Mortgage Type
New Conventional
Purchase Details
Closed on
Aug 23, 2019
Sold by
Killelea Thomas J and Killelea Brandy M
Bought by
Killelea Ft and Killelea
Purchase Details
Closed on
Jun 28, 2011
Sold by
Fnma
Bought by
Killelea Thomas J and Killelea Brandy M
Home Financials for this Owner
Home Financials are based on the most recent Mortgage that was taken out on this home.
Original Mortgage
$344,250
Interest Rate
4.63%
Mortgage Type
Purchase Money Mortgage
Purchase Details
Closed on
Mar 4, 2011
Sold by
Turgeon Piper and Fnma
Bought by
Fnma
Purchase Details
Closed on
Apr 24, 2008
Sold by
Diamond Edge Rlty & Dev and Diamond Dev
Bought by
Romanowski Joseph and Turgeon Piper
Purchase Details
Closed on
Jan 10, 2008
Sold by
Homes By Paradise Inc
Bought by
Diamond Edge Rlty & Dev and Diamond Dev
Create a Home Valuation Report for This Property
The Home Valuation Report is an in-depth analysis detailing your home's value as well as a comparison with similar homes in the area
Home Values in the Area
Average Home Value in this Area
Purchase History
| Date | Buyer | Sale Price | Title Company |
|---|---|---|---|
| Killelea Ft | -- | None Available | |
| Killelea Ft | -- | None Available | |
| Marston-Killelea Brandy | -- | None Available | |
| Killelea Ft | -- | None Available | |
| Killelea Ft | -- | None Available | |
| Killelea Ft | -- | None Available | |
| Killelea Ft | -- | -- | |
| Killelea Ft | -- | -- | |
| Killelea Ft | -- | -- | |
| Killelea Thomas J | $354,900 | -- | |
| Fnma | $348,400 | -- | |
| Romanowski Joseph | $382,400 | -- | |
| Diamond Edge Rlty & Dev | $140,000 | -- | |
| Killelea Thomas J | $354,900 | -- | |
| Fnma | $348,400 | -- | |
| Romanowski Joseph | $382,400 | -- | |
| Diamond Edge Rlty & Dev | $140,000 | -- |
Source: Public Records
Mortgage History
| Date | Status | Borrower | Loan Amount |
|---|---|---|---|
| Open | Marston-Killelea Brandy | $420,000 | |
| Closed | Killelea Ft | $420,000 | |
| Previous Owner | Killelea Ft | $399,584 | |
| Previous Owner | Diamond Edge Rlty & Dev | $344,250 |
Source: Public Records
Tax History Compared to Growth
Tax History
| Year | Tax Paid | Tax Assessment Tax Assessment Total Assessment is a certain percentage of the fair market value that is determined by local assessors to be the total taxable value of land and additions on the property. | Land | Improvement |
|---|---|---|---|---|
| 2024 | $11,761 | $728,700 | $241,700 | $487,000 |
| 2023 | $11,404 | $728,700 | $241,700 | $487,000 |
| 2022 | $10,842 | $586,700 | $181,200 | $405,500 |
| 2021 | $10,784 | $586,700 | $181,200 | $405,500 |
| 2020 | $10,190 | $506,700 | $145,000 | $361,700 |
| 2019 | $9,825 | $506,700 | $145,000 | $361,700 |
| 2018 | $9,407 | $434,100 | $121,100 | $313,000 |
| 2017 | $9,381 | $434,100 | $121,100 | $313,000 |
| 2016 | $9,267 | $431,000 | $121,100 | $309,900 |
| 2015 | $8,778 | $417,600 | $121,100 | $296,500 |
| 2014 | $8,807 | $417,600 | $121,100 | $296,500 |
| 2011 | -- | $426,700 | $121,100 | $305,600 |
Source: Public Records
Map
Nearby Homes
- 15 Alan Cir
- 13 Moose Hollow Rd
- 20 Locke Mill Dr
- 19 Dixon Dr
- 10 Jason Dr
- 4 Quincy Rd Unit A
- 23 Wiley Hill Rd
- 3 Chandler Dr
- 12 Wiley Hill Rd
- 30 Windsor Dr Unit 9
- 35 Windsor Dr Unit 5
- 11 Windsor Dr Unit B
- 41 Century Ln
- 7 Chamberlin Dr
- 6 Wiley Hill Rd
- 88 High Range Rd
- 90 High Range Rd
- 25 Chatfield Dr
- 0 Tallarico St Unit 3 5032471
- 0 Tallarico St Unit 5 5032751
- 21 Tanager Way
- 25 Tanager Way
- 36 Tanager Way
- 19 Tanager Way
- 23 Tanager Way
- 29 Tanager Way
- 17 Tanager Way
- 38 Tanager Way
- 24 Tanager Way
- 22 Tanager Way
- 34 Tanager Way
- 20 Tanager Way
- 18 Tanager Way
- 31 Tanager Way
- 32 Tanager Way
- 15 Tanager Way
- 16 Tanager Way
- 28 Tanager Way
- 26 Tanager Way
- 4 Whippoorwill Cir