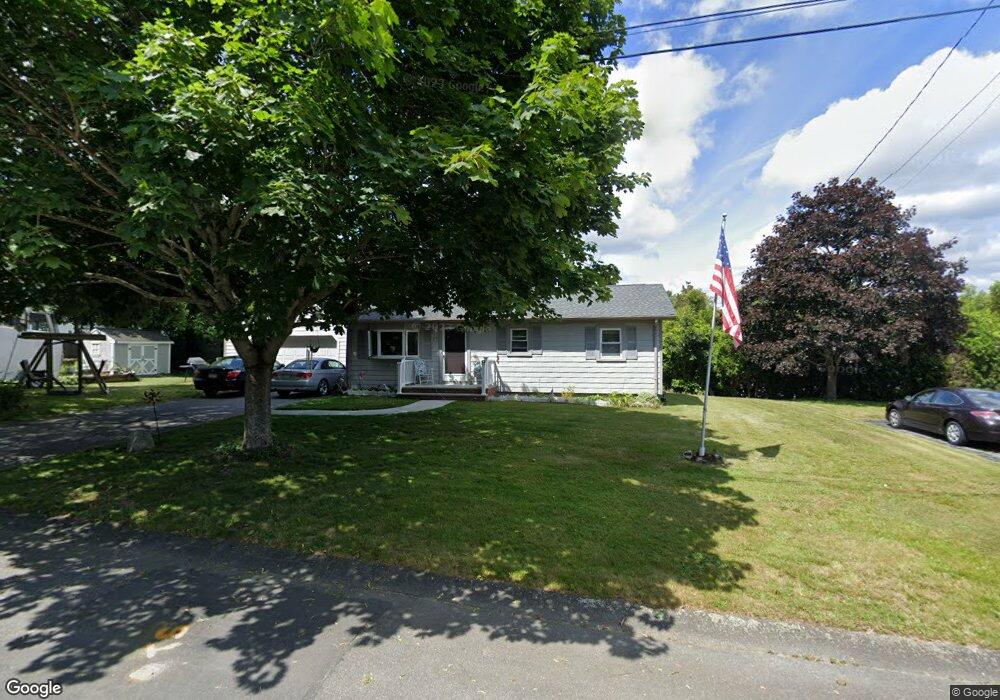
27 Union St Acushnet, MA 02743
North Fairhaven NeighborhoodEstimated Value: $370,000 - $429,000
2
Beds
1
Bath
1,449
Sq Ft
$280/Sq Ft
Est. Value
About This Home
This home is located at 27 Union St, Acushnet, MA 02743 and is currently estimated at $405,585, approximately $279 per square foot. 27 Union St is a home located in Bristol County with nearby schools including Acushnet Elementary School, Albert F Ford Middle School, and St Francis Xavier Elementary School.
Ownership History
Date
Name
Owned For
Owner Type
Purchase Details
Closed on
Jun 1, 2022
Sold by
Ferreira Robert A and Ferreira Diane
Bought by
Ferreira Lt and Ferreira
Current Estimated Value
Purchase Details
Closed on
Sep 8, 1976
Bought by
Ferreira Robert A and Ferreira Diane
Create a Home Valuation Report for This Property
The Home Valuation Report is an in-depth analysis detailing your home's value as well as a comparison with similar homes in the area
Home Values in the Area
Average Home Value in this Area
Purchase History
| Date | Buyer | Sale Price | Title Company |
|---|---|---|---|
| Ferreira Lt | -- | None Available | |
| Ferreira Robert A | -- | -- |
Source: Public Records
Mortgage History
| Date | Status | Borrower | Loan Amount |
|---|---|---|---|
| Previous Owner | Ferreira Robert A | $25,000 | |
| Previous Owner | Ferreira Robert A | $11,000 |
Source: Public Records
Tax History
| Year | Tax Paid | Tax Assessment Tax Assessment Total Assessment is a certain percentage of the fair market value that is determined by local assessors to be the total taxable value of land and additions on the property. | Land | Improvement |
|---|---|---|---|---|
| 2025 | $37 | $346,400 | $91,500 | $254,900 |
| 2024 | $3,563 | $312,300 | $87,300 | $225,000 |
| 2023 | $3,456 | $288,000 | $78,800 | $209,200 |
| 2022 | $3,434 | $258,800 | $74,500 | $184,300 |
| 2021 | $3,300 | $238,600 | $74,500 | $164,100 |
| 2020 | $3,326 | $238,600 | $74,500 | $164,100 |
| 2019 | $3,118 | $219,900 | $66,000 | $153,900 |
| 2018 | $3,002 | $208,200 | $66,000 | $142,200 |
| 2017 | $2,891 | $200,200 | $66,000 | $134,200 |
| 2016 | $2,804 | $193,000 | $66,000 | $127,000 |
| 2015 | $2,650 | $185,600 | $66,000 | $119,600 |
Source: Public Records
Map
Nearby Homes
Your Personal Tour Guide
Ask me questions while you tour the home.