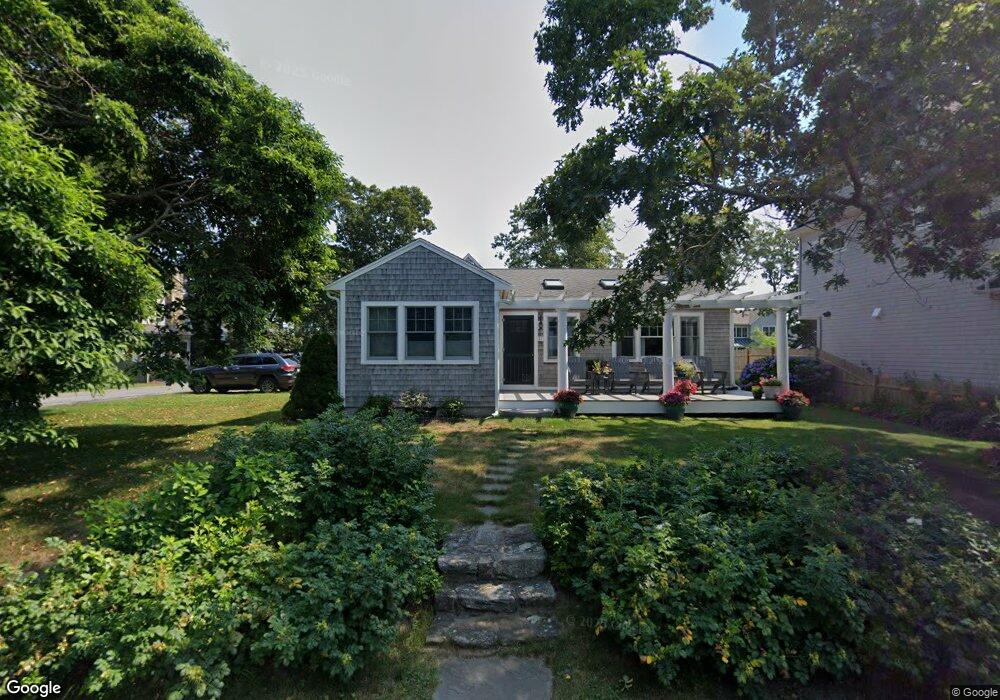
27 West Ave Marion, MA 02738
Estimated Value: $690,000 - $1,251,000
3
Beds
2
Baths
1,110
Sq Ft
$912/Sq Ft
Est. Value
About This Home
This home is located at 27 West Ave, Marion, MA 02738 and is currently estimated at $1,012,639, approximately $912 per square foot. 27 West Ave is a home located in Plymouth County with nearby schools including Old Rochester Regional High School.
Ownership History
Date
Name
Owned For
Owner Type
Purchase Details
Closed on
Dec 29, 2015
Sold by
Plumb 4Th J Hudson
Bought by
Plumb Martha E and Hudson Plumb J
Current Estimated Value
Purchase Details
Closed on
Nov 20, 2001
Sold by
Moran Ann T and Hobbs Mary C
Bought by
Plumb J Hudson
Purchase Details
Closed on
Oct 31, 2000
Sold by
Bent Peter E and Bent Anne C
Bought by
Moran Anne T and Hobbs Mary C
Purchase Details
Closed on
Sep 12, 1990
Sold by
Lipsitt Cyrus D
Bought by
Bent Peter E
Home Financials for this Owner
Home Financials are based on the most recent Mortgage that was taken out on this home.
Original Mortgage
$100,000
Interest Rate
9.76%
Mortgage Type
Purchase Money Mortgage
Create a Home Valuation Report for This Property
The Home Valuation Report is an in-depth analysis detailing your home's value as well as a comparison with similar homes in the area
Home Values in the Area
Average Home Value in this Area
Purchase History
| Date | Buyer | Sale Price | Title Company |
|---|---|---|---|
| Plumb Martha E | -- | -- | |
| Plumb J Hudson | $412,000 | -- | |
| Moran Anne T | $299,000 | -- | |
| Bent Peter E | $207,500 | -- |
Source: Public Records
Mortgage History
| Date | Status | Borrower | Loan Amount |
|---|---|---|---|
| Previous Owner | Bent Peter E | $102,000 | |
| Previous Owner | Bent Peter E | $100,000 |
Source: Public Records
Tax History Compared to Growth
Tax History
| Year | Tax Paid | Tax Assessment Tax Assessment Total Assessment is a certain percentage of the fair market value that is determined by local assessors to be the total taxable value of land and additions on the property. | Land | Improvement |
|---|---|---|---|---|
| 2025 | $8,924 | $957,479 | $716,779 | $240,700 |
| 2024 | $8,323 | $898,850 | $654,450 | $244,400 |
| 2023 | $7,733 | $819,204 | $607,704 | $211,500 |
| 2022 | $8,302 | $765,169 | $587,169 | $178,000 |
| 2021 | $6,485 | $686,199 | $518,599 | $167,600 |
| 2020 | $5,940 | $574,500 | $414,000 | $160,500 |
| 2019 | $5,829 | $528,500 | $377,000 | $151,500 |
| 2018 | $6,267 | $547,300 | $418,200 | $129,100 |
| 2017 | $6,149 | $538,900 | $418,200 | $120,700 |
| 2016 | $6,133 | $542,300 | $418,200 | $124,100 |
| 2015 | $5,773 | $519,600 | $412,300 | $107,300 |
Source: Public Records
Map
Nearby Homes