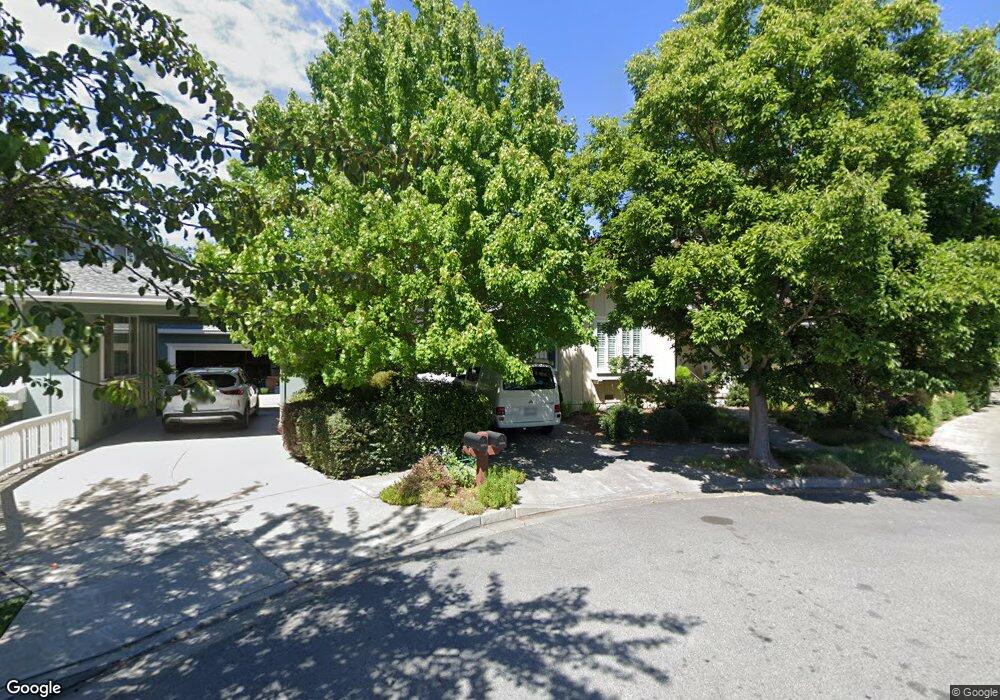
270 Macarthur Ln Sonoma, CA 95476
Estimated Value: $1,312,000 - $1,472,000
3
Beds
3
Baths
1,695
Sq Ft
$838/Sq Ft
Est. Value
About This Home
This home is located at 270 Macarthur Ln, Sonoma, CA 95476 and is currently estimated at $1,420,775, approximately $838 per square foot. 270 Macarthur Ln is a home located in Sonoma County with nearby schools including Prestwood Elementary School, Adele Harrison Middle School, and Creekside High School.
Ownership History
Date
Name
Owned For
Owner Type
Purchase Details
Closed on
Sep 14, 2010
Sold by
Wicklund Jane Ann and Wicklund Richard Gary
Bought by
Wicklund Jane Ann and Wicklund Richard Gary
Current Estimated Value
Home Financials for this Owner
Home Financials are based on the most recent Mortgage that was taken out on this home.
Original Mortgage
$544,000
Outstanding Balance
$358,125
Interest Rate
4.38%
Mortgage Type
New Conventional
Estimated Equity
$1,062,650
Purchase Details
Closed on
Jun 15, 2007
Sold by
Wicklund Jane and Wicklund Richard G
Bought by
Wicklund Jane Ann and Wicklund Richard Gary
Purchase Details
Closed on
Aug 5, 2003
Sold by
Ryder Homes Of California Inc
Bought by
Wicklund Richard G and Wicklund Jane
Home Financials for this Owner
Home Financials are based on the most recent Mortgage that was taken out on this home.
Original Mortgage
$539,000
Interest Rate
5.29%
Mortgage Type
Purchase Money Mortgage
Create a Home Valuation Report for This Property
The Home Valuation Report is an in-depth analysis detailing your home's value as well as a comparison with similar homes in the area
Home Values in the Area
Average Home Value in this Area
Purchase History
| Date | Buyer | Sale Price | Title Company |
|---|---|---|---|
| Wicklund Jane Ann | -- | Chicago Title Company | |
| Wicklund Jane Ann | -- | None Available | |
| Wicklund Richard G | $674,500 | North American Title Co |
Source: Public Records
Mortgage History
| Date | Status | Borrower | Loan Amount |
|---|---|---|---|
| Open | Wicklund Jane Ann | $544,000 | |
| Closed | Wicklund Richard G | $539,000 | |
| Closed | Wicklund Richard G | $67,700 |
Source: Public Records
Tax History
| Year | Tax Paid | Tax Assessment Tax Assessment Total Assessment is a certain percentage of the fair market value that is determined by local assessors to be the total taxable value of land and additions on the property. | Land | Improvement |
|---|---|---|---|---|
| 2025 | $11,893 | $958,416 | $426,531 | $531,885 |
| 2024 | $11,893 | $939,624 | $418,168 | $521,456 |
| 2023 | $11,893 | $921,201 | $409,969 | $511,232 |
| 2022 | $11,452 | $903,139 | $401,931 | $501,208 |
| 2021 | $11,211 | $885,431 | $394,050 | $491,381 |
| 2020 | $11,398 | $876,353 | $390,010 | $486,343 |
| 2019 | $10,928 | $859,170 | $382,363 | $476,807 |
| 2018 | $10,842 | $842,324 | $374,866 | $467,458 |
| 2017 | $10,905 | $825,809 | $367,516 | $458,293 |
| 2016 | $10,005 | $809,617 | $360,310 | $449,307 |
| 2015 | $9,685 | $797,456 | $354,898 | $442,558 |
| 2014 | $9,697 | $774,000 | $344,000 | $430,000 |
Source: Public Records
Map
Nearby Homes
- 280 Macarthur Ln
- 260 Macarthur Ln
- 281 E Macarthur St
- 271 E Macarthur St
- 291 E Macarthur St
- 291 Macarthur Ln
- 920 Donner Ave
- 930 Donner Ave
- 301 E Macarthur St
- 281 Macarthur Ln
- 261 Macarthur Ln
- 251 Macarthur Ln
- 280 E Macarthur St
- 292 E Macarthur St
- 270 E Macarthur St
- 929 Donner Ave
- 890 3rd St E
- 901 Donner Ave
- 241 Macarthur Ln
- 890 Donner Ave