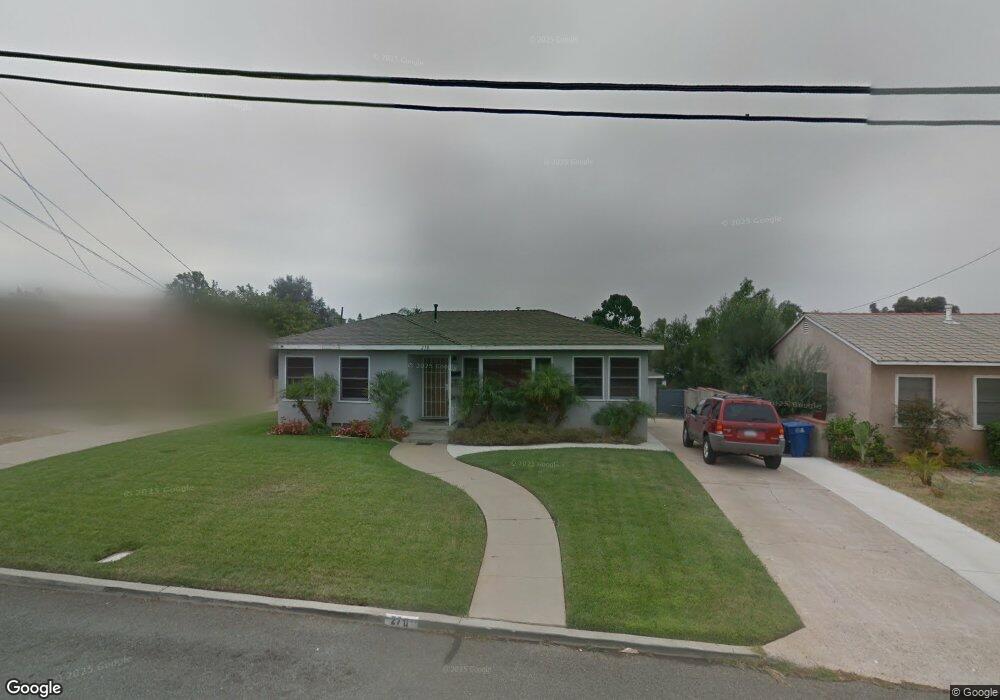
270 Shirley St Chula Vista, CA 91910
North Chula Vista NeighborhoodEstimated Value: $658,822 - $948,000
3
Beds
1
Bath
1,035
Sq Ft
$761/Sq Ft
Est. Value
About This Home
This home is located at 270 Shirley St, Chula Vista, CA 91910 and is currently estimated at $787,956, approximately $761 per square foot. 270 Shirley St is a home located in San Diego County with nearby schools including Rosebank Elementary School, Hilltop Middle School, and Hilltop Senior High School.
Ownership History
Date
Name
Owned For
Owner Type
Purchase Details
Closed on
Nov 13, 2024
Sold by
Adame Jared Joseph
Bought by
Adame Jared Joseph
Current Estimated Value
Home Financials for this Owner
Home Financials are based on the most recent Mortgage that was taken out on this home.
Original Mortgage
$85,000
Interest Rate
6.12%
Mortgage Type
Construction
Purchase Details
Closed on
Oct 31, 2024
Sold by
Adame Jessica Marie
Bought by
Adame Jared Joseph
Home Financials for this Owner
Home Financials are based on the most recent Mortgage that was taken out on this home.
Original Mortgage
$85,000
Interest Rate
6.12%
Mortgage Type
Construction
Purchase Details
Closed on
Jun 24, 1994
Sold by
Burns John Jackson
Bought by
Adame Jared Joseph
Purchase Details
Closed on
Jun 21, 1994
Sold by
Smith Constance Marie
Bought by
Adame Jared Joseph
Purchase Details
Closed on
Jun 17, 1994
Sold by
Porritt Georgia Ann
Bought by
Adame Jared Joseph
Purchase Details
Closed on
Jun 16, 1994
Sold by
Nybo Patricia Joan
Bought by
Adame Jared Joseph
Create a Home Valuation Report for This Property
The Home Valuation Report is an in-depth analysis detailing your home's value as well as a comparison with similar homes in the area
Home Values in the Area
Average Home Value in this Area
Purchase History
| Date | Buyer | Sale Price | Title Company |
|---|---|---|---|
| Adame Jared Joseph | -- | Wfg National Title | |
| Adame Jared Joseph | -- | Wfg National Title | |
| Adame Jared Joseph | -- | Wfg National Title | |
| Adame Jared Joseph | -- | -- | |
| Adame Jared Joseph | -- | -- | |
| Adame Jared Joseph | $100,000 | -- | |
| Adame Jared Joseph | -- | -- | |
| Adame Jared Joseph | -- | -- | |
| Adame Jared Joseph | -- | -- |
Source: Public Records
Mortgage History
| Date | Status | Borrower | Loan Amount |
|---|---|---|---|
| Closed | Adame Jared Joseph | $85,000 | |
| Open | Adame Jared Joseph | $472,500 |
Source: Public Records
Tax History Compared to Growth
Tax History
| Year | Tax Paid | Tax Assessment Tax Assessment Total Assessment is a certain percentage of the fair market value that is determined by local assessors to be the total taxable value of land and additions on the property. | Land | Improvement |
|---|---|---|---|---|
| 2025 | $2,344 | $201,527 | $117,560 | $83,967 |
| 2024 | $2,344 | $197,576 | $115,255 | $82,321 |
| 2023 | $2,311 | $193,703 | $112,996 | $80,707 |
| 2022 | $2,245 | $189,906 | $110,781 | $79,125 |
| 2021 | $2,194 | $186,183 | $108,609 | $77,574 |
| 2020 | $2,142 | $184,275 | $107,496 | $76,779 |
| 2019 | $2,087 | $180,663 | $105,389 | $75,274 |
| 2018 | $2,055 | $177,122 | $103,323 | $73,799 |
| 2017 | $13 | $173,650 | $101,298 | $72,352 |
| 2016 | $1,964 | $170,246 | $99,312 | $70,934 |
| 2015 | $1,937 | $167,690 | $97,821 | $69,869 |
| 2014 | $1,905 | $164,406 | $95,905 | $68,501 |
Source: Public Records
Map
Nearby Homes
- 259 Vista Del Mar Ct
- 50 Via Nomentana
- 81 2nd Ave
- 110 N 2nd Ave Unit 40
- 110 N 2nd Ave Unit 27
- 113 2nd
- 99 Minot Ave
- 61 1st Ave
- 138 Minot Ave
- 91 Flower St
- 160 E St Unit C1
- 170 E St Unit D5
- 150 E St Unit A1
- 185 Corte Helena Ave
- 194 Corte Helena Ave
- 141 Brightwood Ave
- 74 E St
- 134-38 5th Ave
- 3007 Shelby Dr
- 54-58 Smith Ave