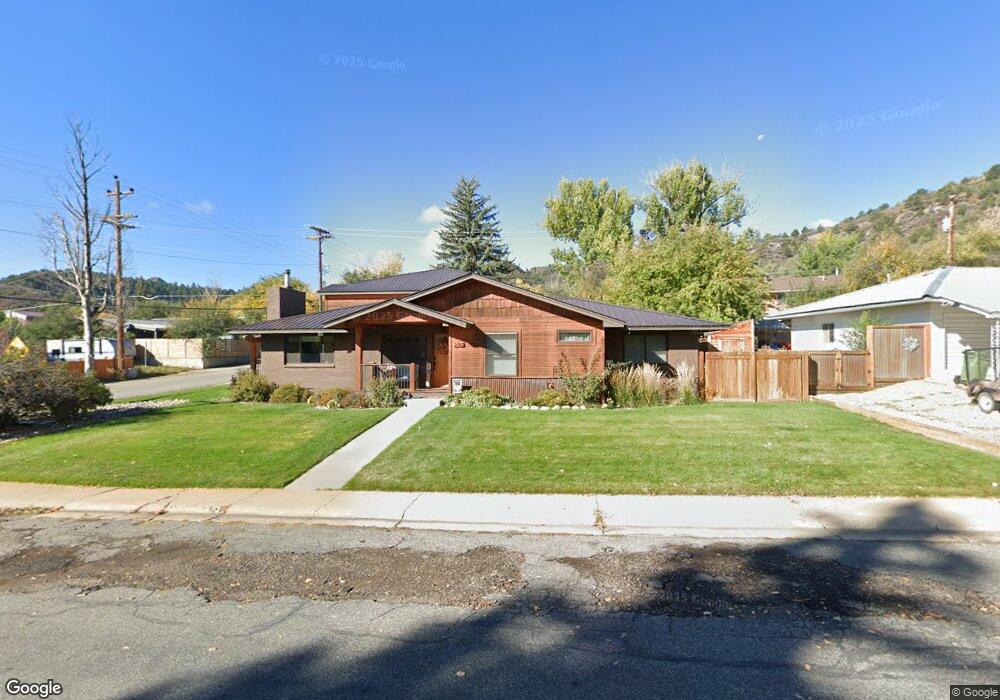
2701 Columbine Dr Durango, CO 81301
Needham NeighborhoodEstimated Value: $1,083,266 - $1,287,000
3
Beds
3
Baths
2,714
Sq Ft
$438/Sq Ft
Est. Value
About This Home
This home is located at 2701 Columbine Dr, Durango, CO 81301 and is currently estimated at $1,189,567, approximately $438 per square foot. 2701 Columbine Dr is a home located in La Plata County with nearby schools including Needham Elementary School, Miller Middle School, and Durango High School.
Ownership History
Date
Name
Owned For
Owner Type
Purchase Details
Closed on
Jun 12, 2019
Sold by
Greco William F
Bought by
Wilson Brent M and El Hossari Megan Claire
Current Estimated Value
Home Financials for this Owner
Home Financials are based on the most recent Mortgage that was taken out on this home.
Original Mortgage
$559,200
Outstanding Balance
$491,674
Interest Rate
4.1%
Mortgage Type
New Conventional
Estimated Equity
$697,893
Purchase Details
Closed on
Nov 30, 2018
Sold by
Greco William F and Greco Sandra K
Bought by
Greco William F
Home Financials for this Owner
Home Financials are based on the most recent Mortgage that was taken out on this home.
Original Mortgage
$410,000
Interest Rate
4.8%
Mortgage Type
New Conventional
Purchase Details
Closed on
May 24, 2013
Sold by
Goodman Roy D and Goodman Ozeli P
Bought by
Greco William F and Greco Sandra K
Home Financials for this Owner
Home Financials are based on the most recent Mortgage that was taken out on this home.
Original Mortgage
$216,000
Interest Rate
3.45%
Mortgage Type
New Conventional
Create a Home Valuation Report for This Property
The Home Valuation Report is an in-depth analysis detailing your home's value as well as a comparison with similar homes in the area
Home Values in the Area
Average Home Value in this Area
Purchase History
| Date | Buyer | Sale Price | Title Company |
|---|---|---|---|
| Wilson Brent M | $699,000 | Land Title Guarantee Co | |
| Greco William F | $210,000 | Service Link | |
| Greco William F | $360,000 | Land Title Guarantee Co |
Source: Public Records
Mortgage History
| Date | Status | Borrower | Loan Amount |
|---|---|---|---|
| Open | Wilson Brent M | $559,200 | |
| Previous Owner | Greco William F | $410,000 | |
| Previous Owner | Greco William F | $216,000 |
Source: Public Records
Tax History
| Year | Tax Paid | Tax Assessment Tax Assessment Total Assessment is a certain percentage of the fair market value that is determined by local assessors to be the total taxable value of land and additions on the property. | Land | Improvement |
|---|---|---|---|---|
| 2025 | $2,609 | $63,490 | $14,610 | $48,880 |
| 2024 | $2,219 | $55,220 | $11,070 | $44,150 |
| 2023 | $2,219 | $58,460 | $11,720 | $46,740 |
| 2022 | $1,949 | $61,100 | $12,250 | $48,850 |
| 2021 | $1,957 | $49,310 | $10,550 | $38,760 |
| 2020 | $1,799 | $46,780 | $10,460 | $36,320 |
| 2019 | $1,542 | $41,930 | $10,460 | $31,470 |
| 2018 | $1,490 | $41,020 | $10,650 | $30,370 |
| 2017 | $1,457 | $41,020 | $10,650 | $30,370 |
| 2016 | $1,327 | $40,700 | $9,440 | $31,260 |
| 2015 | $1,243 | $40,700 | $9,440 | $31,260 |
| 2014 | -- | $26,330 | $9,050 | $17,280 |
| 2013 | -- | $26,330 | $9,050 | $17,280 |
Source: Public Records
Map
Nearby Homes
- 416 W 28th St
- 2400 Arroyo Dr Unit 22
- 2930 W 2nd Ave
- 2855 Main Ave Unit A201
- 2855 Main Ave Unit A209
- 300 W 32nd St Unit 102
- 3100 & 3104 W 2nd Ave
- 3147 W 2nd Ave
- 362 W 23rd St
- 3226 W 4th Ave
- 3211 W 2 Nd Ave
- 150 E 33rd St Unit 103
- 3416 Main Ave Unit 203
- 2024 W 2nd Ave
- 25 Perins Vista Dr
- 138 Riverview Dr
- 1857 & 1865 W 3rd Ave
- 1867 W 2nd Ave
- 1840 W 3rd Ave
- 3575 Main Ave
- 2703 Columbine Dr
- 2617 Columbine Dr
- 2702 Delwood Ave
- 2616 Delwood Ave
- 395 Clovis Dr
- 2702 Columbine Dr
- 2705 Columbine Dr
- 2615 Columbine Dr
- 2704 Columbine Dr
- 2614 Delwood Ave
- 2618 Columbine Dr
- 2613 Columbine Dr
- 2701 Delwood Ave
- 2706 Columbine Dr
- 2703 Delwood Ave
- 2616 Columbine Dr
- 23 Bacus Ave
- 2617 Delwood Ave
- 21 Bacus Ave
- 2612 Delwood Ave
Your Personal Tour Guide
Ask me questions while you tour the home.