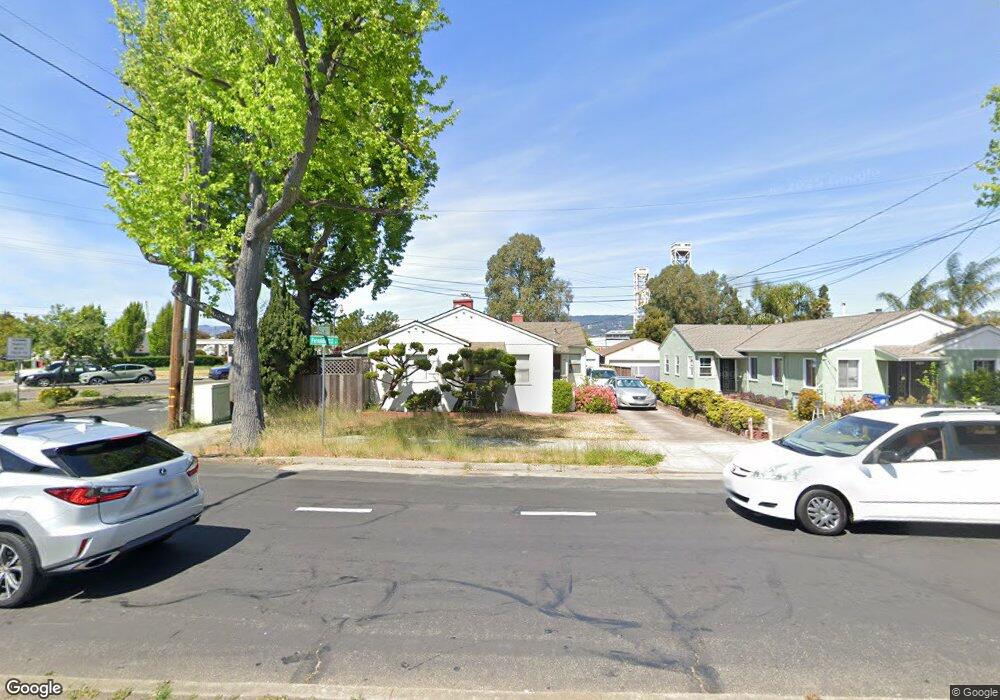
2701 Fernside Blvd Alameda, CA 94501
Downtown Alameda NeighborhoodEstimated Value: $1,161,000 - $1,357,193
4
Beds
2
Baths
1,486
Sq Ft
$833/Sq Ft
Est. Value
About This Home
This home is located at 2701 Fernside Blvd, Alameda, CA 94501 and is currently estimated at $1,237,298, approximately $832 per square foot. 2701 Fernside Blvd is a home located in Alameda County with nearby schools including Edison Elementary School, Lincoln Middle School, and Alameda High School.
Ownership History
Date
Name
Owned For
Owner Type
Purchase Details
Closed on
Mar 6, 2019
Sold by
Lim Helen Lee and Lim James Hock Chung
Bought by
Lim James Hock Chung and Lim Helen Lee
Current Estimated Value
Purchase Details
Closed on
Sep 3, 2002
Sold by
Galetto John Mario
Bought by
Lim James H C and Lim Helen L
Home Financials for this Owner
Home Financials are based on the most recent Mortgage that was taken out on this home.
Original Mortgage
$367,500
Outstanding Balance
$154,077
Interest Rate
6.29%
Estimated Equity
$1,083,221
Purchase Details
Closed on
Oct 25, 1993
Sold by
Cruz Remegio G and Cruz Helen A
Bought by
Galetto John Mario
Home Financials for this Owner
Home Financials are based on the most recent Mortgage that was taken out on this home.
Original Mortgage
$170,625
Interest Rate
6.95%
Create a Home Valuation Report for This Property
The Home Valuation Report is an in-depth analysis detailing your home's value as well as a comparison with similar homes in the area
Home Values in the Area
Average Home Value in this Area
Purchase History
| Date | Buyer | Sale Price | Title Company |
|---|---|---|---|
| Lim James Hock Chung | -- | None Available | |
| Lim James H C | $490,000 | North American Title Co | |
| Galetto John Mario | $227,500 | First American Title Guarant |
Source: Public Records
Mortgage History
| Date | Status | Borrower | Loan Amount |
|---|---|---|---|
| Open | Lim James H C | $367,500 | |
| Previous Owner | Galetto John Mario | $170,625 |
Source: Public Records
Tax History Compared to Growth
Tax History
| Year | Tax Paid | Tax Assessment Tax Assessment Total Assessment is a certain percentage of the fair market value that is determined by local assessors to be the total taxable value of land and additions on the property. | Land | Improvement |
|---|---|---|---|---|
| 2025 | $10,941 | $709,617 | $212,885 | $496,732 |
| 2024 | $10,941 | $695,706 | $208,712 | $486,994 |
| 2023 | $10,528 | $682,070 | $204,621 | $477,449 |
| 2022 | $10,288 | $668,697 | $200,609 | $468,088 |
| 2021 | $10,035 | $655,590 | $196,677 | $458,913 |
| 2020 | $9,908 | $648,871 | $194,661 | $454,210 |
| 2019 | $9,391 | $636,151 | $190,845 | $445,306 |
| 2018 | $9,155 | $623,681 | $187,104 | $436,577 |
| 2017 | $8,744 | $611,455 | $183,436 | $428,019 |
| 2016 | $8,745 | $599,470 | $179,841 | $419,629 |
| 2015 | $8,709 | $590,468 | $177,140 | $413,328 |
| 2014 | $8,361 | $578,904 | $173,671 | $405,233 |
Source: Public Records
Map
Nearby Homes
- 2853 Regatta Dr Unit 179
- 1831 Harvard Dr
- 303 Bowsman Ct Unit 144
- 340 29th Ave Unit 207
- 340 29th Ave Unit 204
- 1601 Broadway Unit 9
- 1542 Broadway
- 3029 Thompson Ave
- 2310 Pacific Ave
- 2022 High St Unit A
- 2754 E 7th St
- 1611 Lea Ct
- 1021 Santa Ines Ct
- 3103 Central Ave
- 2736 E 10th St
- 3957 Wattling St
- 3246 Garfield Ave
- 2417 Marti Rae Ct
- 2620 Encinal Ave
- 2216 Santa Clara Ave
- 2705 Fernside Blvd
- 2709 Fernside Blvd
- 1830 Pearl St
- 2710 Fernside Blvd
- 1901 Pearl St
- 2671 Blanding Ave
- 2712 Fernside Blvd
- 1824 Pearl St
- 1829 Versailles Ave
- 1831 Pearl St
- 1820 Pearl St
- 1825 Versailles Ave
- 1823 Pearl St
- 1821 Versailles Ave
- 1816 Pearl St
- 1819 Versailles Ave
- 1900 Versailles Ave
- 1815 Pearl St
- 2800 Windsor Dr
- 1812 Pearl St