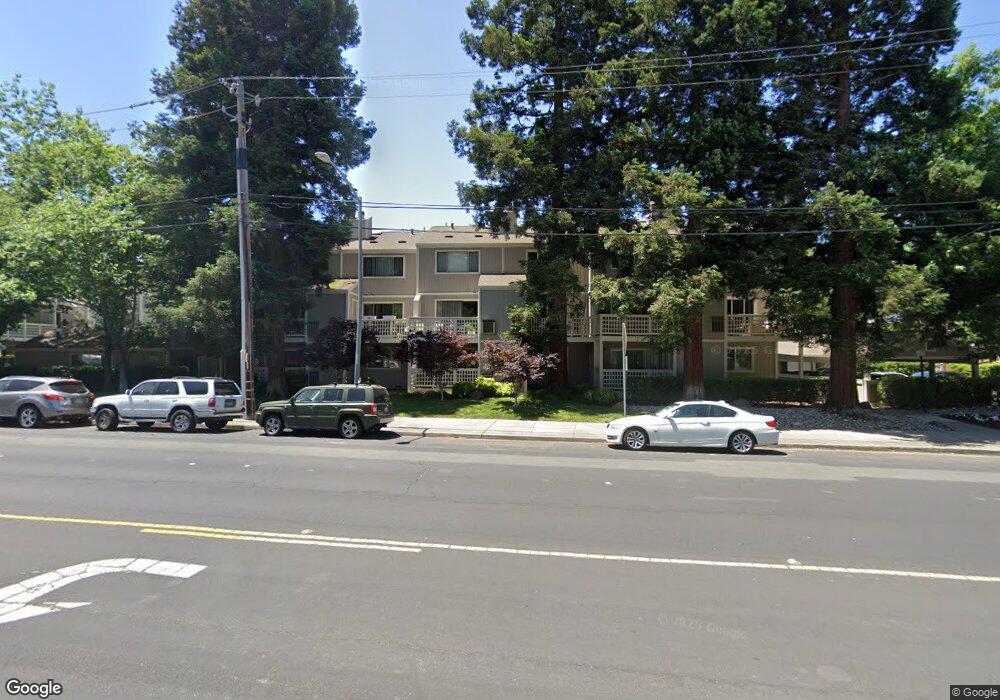
2701 Oak Rd Unit C Walnut Creek, CA 94597
Contra Costa Centre NeighborhoodEstimated Value: $488,000 - $597,000
2
Beds
2
Baths
1,208
Sq Ft
$459/Sq Ft
Est. Value
About This Home
This home is located at 2701 Oak Rd Unit C, Walnut Creek, CA 94597 and is currently estimated at $554,089, approximately $458 per square foot. 2701 Oak Rd Unit C is a home located in Contra Costa County with nearby schools including Buena Vista Elementary School, Walnut Creek Intermediate School, and Las Lomas High School.
Ownership History
Date
Name
Owned For
Owner Type
Purchase Details
Closed on
Jul 2, 2010
Sold by
Landron Rafaela V and Cabreja Rafael David
Bought by
Cabreja Rafael David and Ravelo Rafael Alcides
Current Estimated Value
Purchase Details
Closed on
May 7, 2007
Sold by
Landron Rafaela
Bought by
Ravelo Rafael Alcides and Cabreja Rafael David
Purchase Details
Closed on
Aug 21, 2002
Sold by
Landron Rafaela
Bought by
Landron Rafaela
Home Financials for this Owner
Home Financials are based on the most recent Mortgage that was taken out on this home.
Original Mortgage
$164,000
Interest Rate
5.45%
Mortgage Type
Purchase Money Mortgage
Purchase Details
Closed on
Jun 5, 2002
Sold by
Landron Rafaela and Ravelo Rafaela Landron
Bought by
Landron Rafaela
Purchase Details
Closed on
Jan 23, 1999
Sold by
Ravelo Rafael A
Bought by
Ravelo Rafaela Landron
Create a Home Valuation Report for This Property
The Home Valuation Report is an in-depth analysis detailing your home's value as well as a comparison with similar homes in the area
Home Values in the Area
Average Home Value in this Area
Purchase History
| Date | Buyer | Sale Price | Title Company |
|---|---|---|---|
| Cabreja Rafael David | -- | Pacific Coast Title | |
| Landron Rafaela | -- | Pacific Coast Title | |
| Ravelo Rafael Alcides | -- | Financial Title Company | |
| Landron Rafaela | -- | North American Title Co | |
| Landron Rafaela | -- | -- | |
| Ravelo Rafaela Landron | -- | -- |
Source: Public Records
Mortgage History
| Date | Status | Borrower | Loan Amount |
|---|---|---|---|
| Previous Owner | Landron Rafaela | $164,000 |
Source: Public Records
Tax History
| Year | Tax Paid | Tax Assessment Tax Assessment Total Assessment is a certain percentage of the fair market value that is determined by local assessors to be the total taxable value of land and additions on the property. | Land | Improvement |
|---|---|---|---|---|
| 2025 | $4,125 | $279,376 | $114,930 | $164,446 |
| 2024 | $4,012 | $273,899 | $112,677 | $161,222 |
| 2023 | $4,012 | $268,529 | $110,468 | $158,061 |
| 2022 | $3,975 | $263,264 | $108,302 | $154,962 |
| 2021 | $3,869 | $258,103 | $106,179 | $151,924 |
| 2019 | $3,764 | $250,450 | $103,031 | $147,419 |
| 2018 | $3,653 | $245,540 | $101,011 | $144,529 |
| 2017 | $3,574 | $240,727 | $99,031 | $141,696 |
| 2016 | $3,493 | $236,008 | $97,090 | $138,918 |
| 2015 | $3,414 | $232,464 | $95,632 | $136,832 |
| 2014 | $3,367 | $227,911 | $93,759 | $134,152 |
Source: Public Records
Map
Nearby Homes
- 2709 Oak Rd Unit G
- 236 Oak Cir
- 194 Oak Cir
- 224 Oak Cir
- 214 Oak Cir
- 2739 Oak Rd
- 2724 Oak Rd Unit 86
- 2724 Oak Rd Unit 88
- 2741 Oak Rd
- 2720 Oak Rd Unit 129
- 2721 Oak Rd Unit L
- 2742 Jones Rd
- 132 Oak Cir
- 2780 Jones Rd
- 2627 Oak Rd Unit A
- 2617 Oak Rd Unit C
- 2650 Jones Rd Unit 14
- 2590 Oak Rd Unit 146
- 2590 Oak Rd Unit 247
- 2640 Jones Rd Unit A
- 2701 Oak Rd
- 2701 Oak Rd Unit E
- 2701 Oak Rd Unit G
- 2701 Oak Rd Unit H
- 2701 Oak Rd Unit I
- 2701 Oak Rd Unit A
- 2701 Oak Rd Unit B
- 2701 Oak Rd Unit D
- 2715 Oak Rd Unit I
- 2715 Oak Rd Unit H
- 2715 Oak Rd Unit G
- 2715 Oak Rd Unit F
- 2715 Oak Rd Unit E
- 2715 Oak Rd Unit D
- 2715 Oak Rd Unit C
- 2715 Oak Rd Unit A
- 2725 Oak Rd Unit C
- 2725 Oak Rd Unit D
- 2725 Oak Rd Unit E
- 2725 Oak Rd Unit F
Your Personal Tour Guide
Ask me questions while you tour the home.