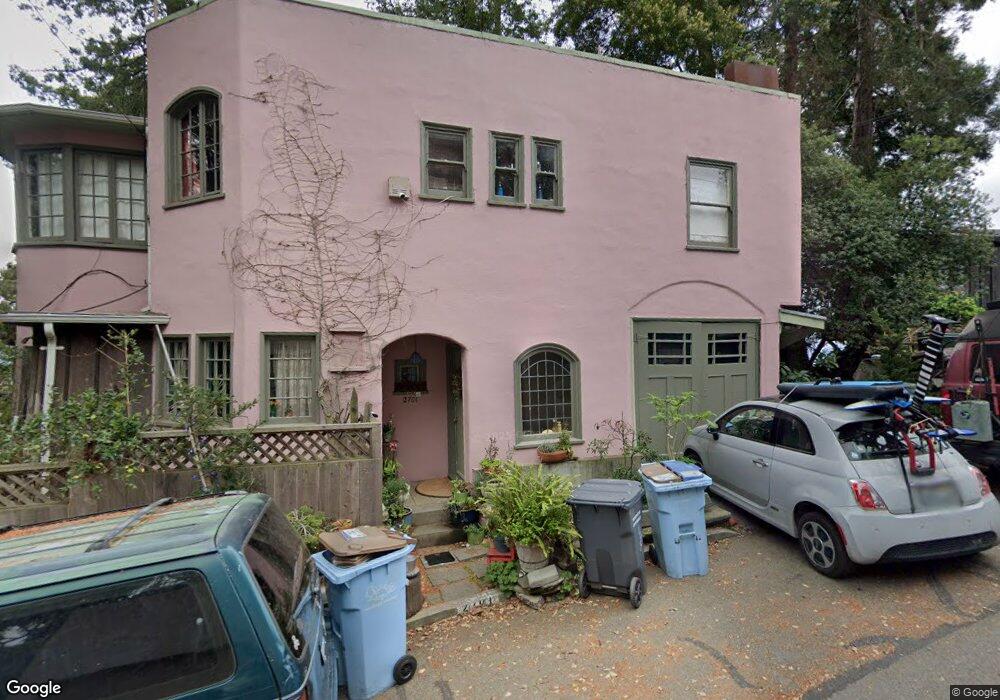
2701 Shasta Rd Berkeley, CA 94708
Berkeley Hills NeighborhoodEstimated Value: $1,462,482 - $1,733,000
4
Beds
2
Baths
2,225
Sq Ft
$725/Sq Ft
Est. Value
About This Home
This home is located at 2701 Shasta Rd, Berkeley, CA 94708 and is currently estimated at $1,613,121, approximately $724 per square foot. 2701 Shasta Rd is a home located in Alameda County with nearby schools including Cragmont Elementary School, Berkeley Arts Magnet at Whittier School, and Washington Elementary School.
Ownership History
Date
Name
Owned For
Owner Type
Purchase Details
Closed on
Jul 29, 2016
Sold by
Moore Margaret Lillian
Bought by
Alexander Christopher and Alexander Christopher W J
Current Estimated Value
Purchase Details
Closed on
Jun 20, 2016
Sold by
Sudarsky Noah M
Bought by
Alexander Lily Catherine
Purchase Details
Closed on
Jun 16, 2016
Sold by
Alexander Christopher and Alexander Christopher W J
Bought by
Alexander Lily Catherine
Purchase Details
Closed on
Feb 19, 2008
Sold by
Alexander Christopher W J and Alexander Pamela H
Bought by
Alexander Christopher W J and Alexander Pamela H
Purchase Details
Closed on
Feb 1, 2008
Sold by
Alexander Pamela
Bought by
Alexander Christopher
Purchase Details
Closed on
Jul 11, 1996
Sold by
Alexander Christopher W and Alexander Pamela H
Bought by
Alexander Christopher W J and Alexander Pamela H
Create a Home Valuation Report for This Property
The Home Valuation Report is an in-depth analysis detailing your home's value as well as a comparison with similar homes in the area
Home Values in the Area
Average Home Value in this Area
Purchase History
| Date | Buyer | Sale Price | Title Company |
|---|---|---|---|
| Alexander Christopher | -- | None Available | |
| Alexander Lily Catherine | -- | None Available | |
| Alexander Lily Catherine | -- | None Available | |
| Alexander Christopher W J | -- | None Available | |
| Alexander Christopher | -- | None Available | |
| Alexander Christopher W J | -- | -- |
Source: Public Records
Tax History
| Year | Tax Paid | Tax Assessment Tax Assessment Total Assessment is a certain percentage of the fair market value that is determined by local assessors to be the total taxable value of land and additions on the property. | Land | Improvement |
|---|---|---|---|---|
| 2025 | $7,740 | $151,561 | $74,534 | $77,027 |
| 2024 | $7,740 | $148,590 | $73,073 | $75,517 |
| 2023 | $7,484 | $145,676 | $71,640 | $74,036 |
| 2022 | $7,400 | $142,820 | $70,235 | $72,585 |
| 2021 | $7,347 | $140,019 | $68,858 | $71,161 |
| 2020 | $6,728 | $138,584 | $68,152 | $70,432 |
| 2019 | $6,202 | $135,867 | $66,816 | $69,051 |
| 2018 | $6,010 | $133,204 | $65,506 | $67,698 |
| 2017 | $5,792 | $130,592 | $64,222 | $66,370 |
| 2016 | $5,385 | $128,032 | $62,963 | $65,069 |
| 2015 | $5,269 | $126,109 | $62,017 | $64,092 |
| 2014 | $5,135 | $123,638 | $60,802 | $62,836 |
Source: Public Records
Map
Nearby Homes
- 2686 Shasta Rd
- 1165 Cragmont Ave
- 2501 Rose Walk
- 1106 Cragmont Ave
- 1110 Sterling Ave
- 1160 Miller Ave
- 2315 Eunice St
- 1375 Queens Rd
- 1221 Grizzly Peak Blvd
- 230 Fairlawn Dr
- 962 Regal Rd
- 2600 Hilgard Ave
- 1085 Creston Rd
- 1004 Cragmont Ave
- 1698 La Loma Ave Unit 1698
- 2121 Eunice St
- 1024 Grizzly Peak Blvd
- 1622 Scenic Ave
- 2421 Hilgard Ave
- 2634 Virginia St Unit 33
- 2712 Shasta Rd
- 2711 Shasta Rd
- 190 Tamalpais Rd
- 188 Tamalpais Rd
- 2704 Shasta Rd
- 2699 Shasta Rd
- 2732 Shasta Rd
- 180 Tamalpais Rd
- 2706 Shasta Rd
- 2715 Shasta Rd
- 100 Tamalpais Rd
- 178 Tamalpais Rd
- 2724 Shasta Rd
- 2702 Shasta Rd
- 2693 Shasta Rd
- 108 Tamalpais Rd
- 2734 Shasta Rd
- 96 Tamalpais Rd
- 2692 Shasta Rd
- 170 Tamalpais Rd
Your Personal Tour Guide
Ask me questions while you tour the home.