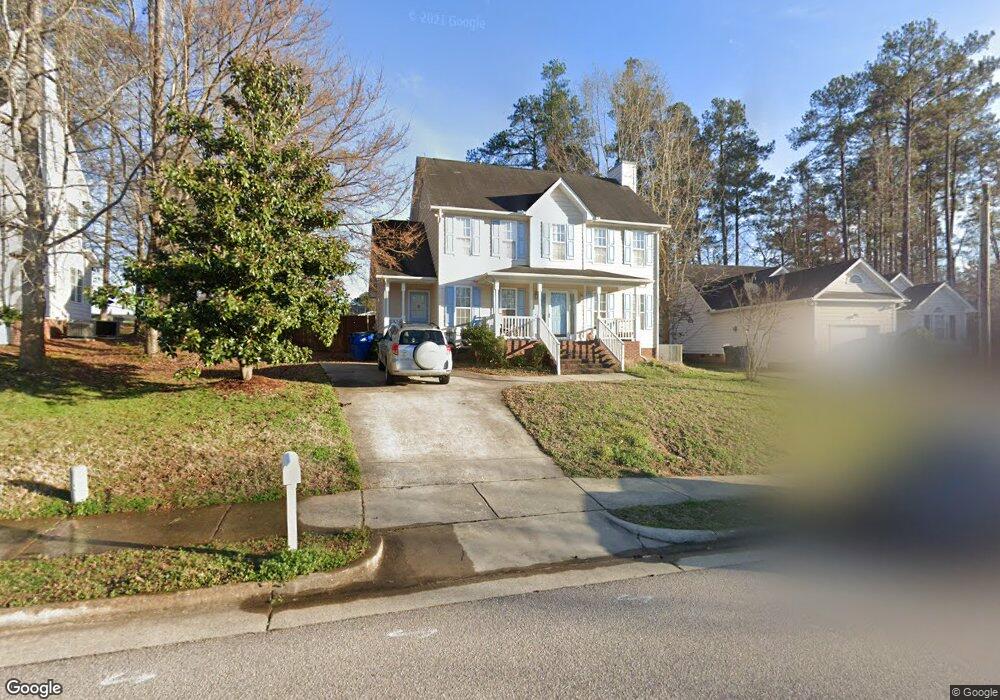
2701 Tryon Pines Dr Raleigh, NC 27603
South Raleigh NeighborhoodEstimated Value: $433,943 - $455,000
3
Beds
3
Baths
1,818
Sq Ft
$244/Sq Ft
Est. Value
About This Home
This home is located at 2701 Tryon Pines Dr, Raleigh, NC 27603 and is currently estimated at $444,236, approximately $244 per square foot. 2701 Tryon Pines Dr is a home located in Wake County with nearby schools including Penny Road Elementary School, Apex Middle, and Apex High School.
Ownership History
Date
Name
Owned For
Owner Type
Purchase Details
Closed on
Jun 27, 2014
Sold by
Kotni Deepak and Kotni Sree Vidya
Bought by
Rideout Jacob R and Rideout Sarah G
Current Estimated Value
Home Financials for this Owner
Home Financials are based on the most recent Mortgage that was taken out on this home.
Original Mortgage
$179,910
Outstanding Balance
$54,879
Interest Rate
3.35%
Mortgage Type
New Conventional
Estimated Equity
$389,357
Purchase Details
Closed on
Nov 3, 2009
Sold by
Young Robert V and Blackwelder Young Kay P
Bought by
Kotni Deepak
Home Financials for this Owner
Home Financials are based on the most recent Mortgage that was taken out on this home.
Original Mortgage
$182,400
Interest Rate
5.04%
Mortgage Type
New Conventional
Purchase Details
Closed on
Oct 28, 1999
Sold by
Bill Clark Homes Of Raleigh Llc
Bought by
Young Robert
Create a Home Valuation Report for This Property
The Home Valuation Report is an in-depth analysis detailing your home's value as well as a comparison with similar homes in the area
Home Values in the Area
Average Home Value in this Area
Purchase History
| Date | Buyer | Sale Price | Title Company |
|---|---|---|---|
| Rideout Jacob R | $200,000 | Meridian Title | |
| Kotni Deepak | $192,000 | None Available | |
| Young Robert | $163,500 | -- |
Source: Public Records
Mortgage History
| Date | Status | Borrower | Loan Amount |
|---|---|---|---|
| Open | Rideout Jacob R | $179,910 | |
| Previous Owner | Kotni Deepak | $182,400 |
Source: Public Records
Tax History Compared to Growth
Tax History
| Year | Tax Paid | Tax Assessment Tax Assessment Total Assessment is a certain percentage of the fair market value that is determined by local assessors to be the total taxable value of land and additions on the property. | Land | Improvement |
|---|---|---|---|---|
| 2025 | $3,374 | $384,548 | $135,000 | $249,548 |
| 2024 | $3,360 | $384,548 | $135,000 | $249,548 |
| 2023 | $2,766 | $251,930 | $65,000 | $186,930 |
| 2022 | $2,571 | $251,930 | $65,000 | $186,930 |
| 2021 | $2,471 | $251,930 | $65,000 | $186,930 |
| 2020 | $2,426 | $251,930 | $65,000 | $186,930 |
| 2019 | $2,370 | $202,783 | $65,000 | $137,783 |
| 2018 | $2,236 | $202,783 | $65,000 | $137,783 |
| 2017 | $2,130 | $202,783 | $65,000 | $137,783 |
| 2016 | $2,086 | $202,783 | $65,000 | $137,783 |
| 2015 | $1,942 | $185,572 | $54,000 | $131,572 |
| 2014 | $1,842 | $185,572 | $54,000 | $131,572 |
Source: Public Records
Map
Nearby Homes
- 2901 Piney Ct
- 1808 Betry Place
- 1626 Bruce Cir
- 1709 Evergreen Ave
- 2837 Tryon Pines Dr
- 2028 Lost Ln
- 1625 Bruce Cir
- 1036 Harper Rd
- 1032 Harper Rd
- 1024 Harper Rd
- 1008 Harper Rd
- 1020 Harper Rd
- 2801 Henslowe Dr
- 2017 Rabbit Run
- 831 Historian St
- 800 Chapanoke Rd
- 1300 Formal Garden Way
- 2208 Sierra Dr
- 1204 Chapanoke Rd
- 1229 Chapanoke Rd
- 2705 Tryon Pines Dr
- 2615 Tryon Pines Dr
- 2718 Crestline Ave
- 2709 Tryon Pines Dr
- 2609 Tryon Pines Dr
- 2614 Piney Ct
- 2712 Crestline Ave
- 2900 Piney Ct
- 2800 Crestline Ave
- 3001 Agent Ct
- 2605 Tryon Pines Dr
- 3005 Agent Ct
- 2904 Piney Ct
- 2706 Crestline Ave
- 2905 Piney Ct
- 2806 Crestline Ave
- 2900 Sap Ln
- 2904 Sap Ln
- 2601 Tryon Pines Dr
- 2719 Crestline Ave