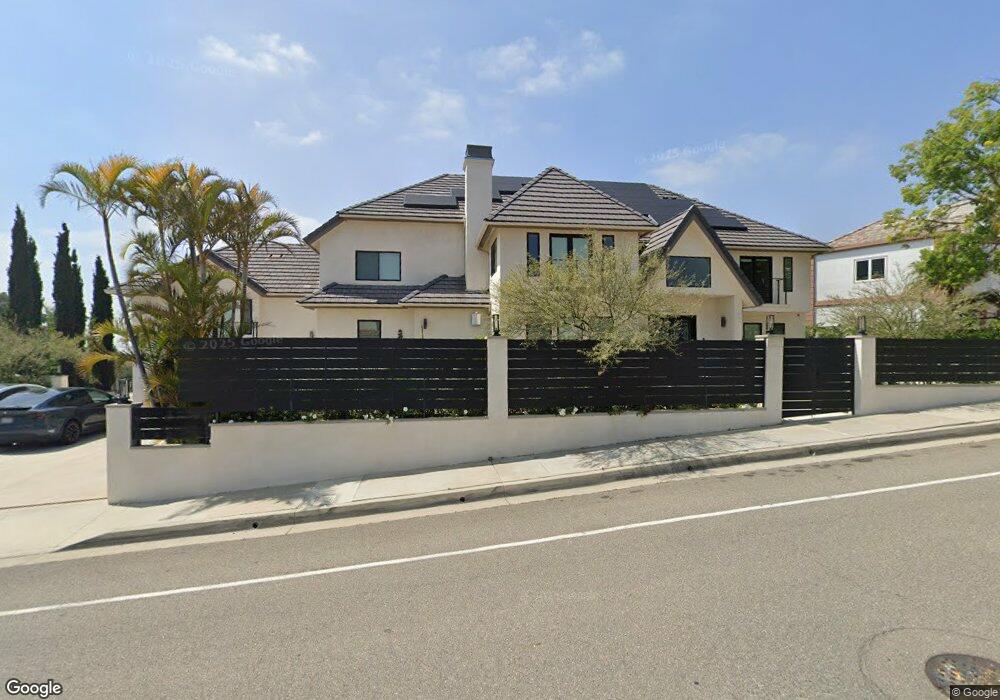
2702 Villareal Dr Orange, CA 92867
Estimated Value: $2,684,000 - $3,271,209
7
Beds
6
Baths
5,409
Sq Ft
$561/Sq Ft
Est. Value
About This Home
This home is located at 2702 Villareal Dr, Orange, CA 92867 and is currently estimated at $3,035,302, approximately $561 per square foot. 2702 Villareal Dr is a home located in Orange County with nearby schools including Nohl Canyon Elementary School, Cerro Villa Middle School, and Villa Park High School.
Ownership History
Date
Name
Owned For
Owner Type
Purchase Details
Closed on
Dec 4, 2019
Sold by
Aarna Investment Corporation
Bought by
Trivedi Shaun and Pal Preti
Current Estimated Value
Purchase Details
Closed on
Oct 29, 2017
Sold by
Ratanjee Dhansukhlal M and Ratanjee Sumati D
Bought by
Aarna Investment Corporation
Home Financials for this Owner
Home Financials are based on the most recent Mortgage that was taken out on this home.
Original Mortgage
$675,000
Interest Rate
3.83%
Mortgage Type
Purchase Money Mortgage
Purchase Details
Closed on
Jul 21, 2010
Sold by
Ratanjee Dhansukhlal M and Ratanjee Sumati D
Bought by
Ratanjee Dhansukhlal M and Ratanjee Sumati D
Create a Home Valuation Report for This Property
The Home Valuation Report is an in-depth analysis detailing your home's value as well as a comparison with similar homes in the area
Home Values in the Area
Average Home Value in this Area
Purchase History
| Date | Buyer | Sale Price | Title Company |
|---|---|---|---|
| Trivedi Shaun | -- | None Available | |
| Aarna Investment Corporation | $1,550,000 | Ticor Title | |
| Ratanjee Dhansukhlal M | -- | None Available | |
| Ratanjee Dhansukhlal M | -- | None Available |
Source: Public Records
Mortgage History
| Date | Status | Borrower | Loan Amount |
|---|---|---|---|
| Previous Owner | Aarna Investment Corporation | $675,000 |
Source: Public Records
Tax History Compared to Growth
Tax History
| Year | Tax Paid | Tax Assessment Tax Assessment Total Assessment is a certain percentage of the fair market value that is determined by local assessors to be the total taxable value of land and additions on the property. | Land | Improvement |
|---|---|---|---|---|
| 2025 | $22,828 | $2,164,292 | $1,076,077 | $1,088,215 |
| 2024 | $22,828 | $2,121,855 | $1,054,977 | $1,066,878 |
| 2023 | $22,335 | $2,080,250 | $1,034,291 | $1,045,959 |
| 2022 | $21,913 | $2,039,461 | $1,014,011 | $1,025,450 |
| 2021 | $21,289 | $1,999,472 | $994,128 | $1,005,344 |
| 2020 | $17,335 | $1,620,148 | $983,934 | $636,214 |
| 2019 | $17,031 | $1,581,000 | $983,934 | $597,066 |
| 2018 | $16,771 | $1,550,000 | $964,641 | $585,359 |
| 2017 | $7,942 | $734,538 | $162,395 | $572,143 |
| 2016 | $7,788 | $720,136 | $159,211 | $560,925 |
| 2015 | $7,675 | $709,319 | $156,819 | $552,500 |
| 2014 | $7,512 | $695,425 | $153,747 | $541,678 |
Source: Public Records
Map
Nearby Homes
- 3148 E East Abbey Ln
- 3216 E Ridgeway Rd
- 3211 E Mandeville Place
- 450 S Mountain Glen Rd
- 2421 N Feather Hill Dr
- 4419 E Orange Creek Ln
- 4263 E Ranch Gate Rd
- 451 S Wishing Well Ln
- 2541 E Denise Ave
- 4410 E Ardmore St
- 2326 N Rockridge Cir
- 421 S Cedarhaven Way
- 4330 E Cornwall Ave
- 3999 E Santa Ana Canyon Rd Unit 106
- 18262 Pamela Place
- 2811 N Roxbury St
- 124 N Tustin Ave
- 2295 N Tustin St Unit 84
- 1931 E Meats Ave Unit 14
- 1931 E Meats Ave Unit 146
- 2702 N Villa Real Dr
- 2674 N Villareal Dr
- 2674 N Villa Real Dr
- 2720 N Villa Real Dr
- 3112 E Woodbine Rd
- 2662 N Villa Real Dr
- 2736 N Villa Real Dr
- 3116 E Woodbine Rd
- 2650 N Villa Real Dr
- 3136 E Abbey Ln
- 3103 E Ridgeway Rd
- 2752 N Villa Real Dr
- 3019 E Lake Hill Dr
- 3139 E Abbey Ln
- 3107 E Ridgeway Rd
- 3128 E Woodbine Rd
- 3115 E Ridgeway Rd
- 3005 E Lake Hill Dr
- 2764 N Villa Real Dr
- 3140 E Woodbine Rd