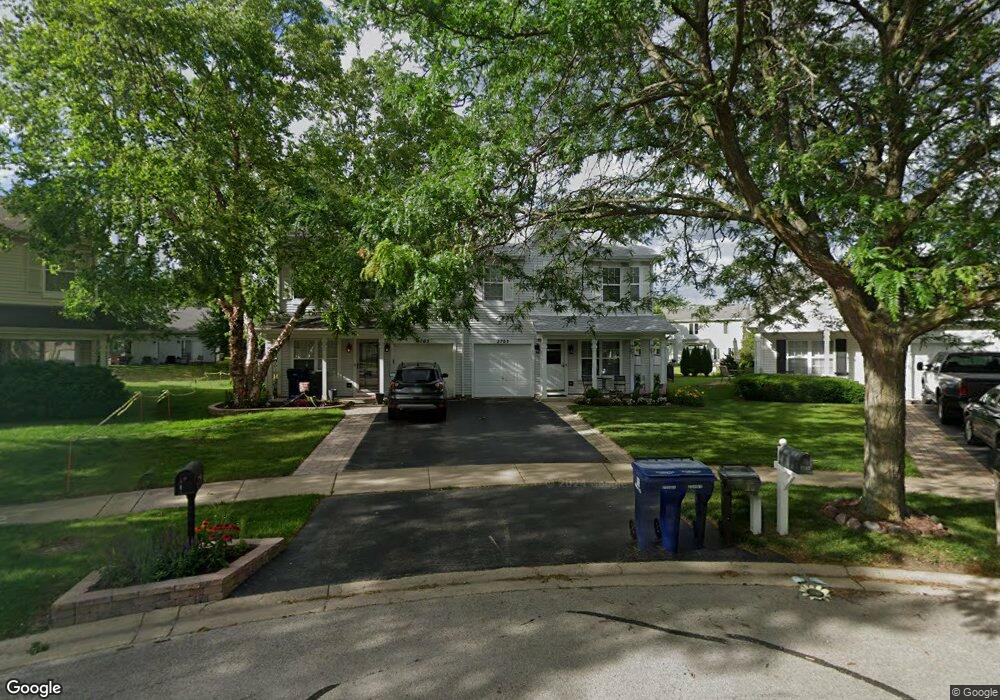
2703 Cripple Creek Ct Naperville, IL 60564
Wood Lake NeighborhoodEstimated Value: $354,000 - $371,000
--
Bed
1
Bath
1,624
Sq Ft
$224/Sq Ft
Est. Value
About This Home
This home is located at 2703 Cripple Creek Ct, Naperville, IL 60564 and is currently estimated at $363,129, approximately $223 per square foot. 2703 Cripple Creek Ct is a home located in Will County with nearby schools including Welch Elementary School, Scullen Middle School, and Neuqua Valley High School.
Ownership History
Date
Name
Owned For
Owner Type
Purchase Details
Closed on
Apr 26, 2021
Sold by
Armstrong Margaret A
Bought by
Armstrong Margaret A and Kkm Family Trust
Current Estimated Value
Purchase Details
Closed on
Aug 20, 1999
Sold by
Newman Steven G and Newman Theresa L
Bought by
Armstrong Margaret A
Home Financials for this Owner
Home Financials are based on the most recent Mortgage that was taken out on this home.
Original Mortgage
$126,500
Outstanding Balance
$36,238
Interest Rate
7.61%
Estimated Equity
$326,891
Purchase Details
Closed on
Feb 26, 1997
Sold by
Woodlake Ltd Partnership
Bought by
Newman Steven G and Newman Theresa L
Home Financials for this Owner
Home Financials are based on the most recent Mortgage that was taken out on this home.
Original Mortgage
$114,600
Interest Rate
7.93%
Create a Home Valuation Report for This Property
The Home Valuation Report is an in-depth analysis detailing your home's value as well as a comparison with similar homes in the area
Home Values in the Area
Average Home Value in this Area
Purchase History
| Date | Buyer | Sale Price | Title Company |
|---|---|---|---|
| Armstrong Margaret A | -- | Attorney | |
| Armstrong Margaret A | $144,500 | Greater Illinois Title Compa | |
| Newman Steven G | $135,000 | Chicago Title Insurance Co |
Source: Public Records
Mortgage History
| Date | Status | Borrower | Loan Amount |
|---|---|---|---|
| Open | Armstrong Margaret A | $126,500 | |
| Previous Owner | Newman Steven G | $114,600 |
Source: Public Records
Tax History Compared to Growth
Tax History
| Year | Tax Paid | Tax Assessment Tax Assessment Total Assessment is a certain percentage of the fair market value that is determined by local assessors to be the total taxable value of land and additions on the property. | Land | Improvement |
|---|---|---|---|---|
| 2024 | $5,829 | $104,988 | $29,956 | $75,032 |
| 2023 | $5,829 | $92,746 | $26,463 | $66,283 |
| 2022 | $5,217 | $83,011 | $25,034 | $57,977 |
| 2021 | $3,728 | $79,058 | $23,842 | $55,216 |
| 2020 | $3,719 | $77,805 | $23,464 | $54,341 |
| 2019 | $3,765 | $75,613 | $22,803 | $52,810 |
| 2018 | $4,259 | $67,849 | $22,302 | $45,547 |
| 2017 | $3,880 | $66,097 | $21,726 | $44,371 |
| 2016 | $3,962 | $64,674 | $21,258 | $43,416 |
| 2015 | $4,899 | $62,186 | $20,440 | $41,746 |
| 2014 | $4,899 | $65,553 | $20,440 | $45,113 |
| 2013 | $4,899 | $65,553 | $20,440 | $45,113 |
Source: Public Records
Map
Nearby Homes
- 2611 Cedar Glade Dr Unit 204
- 2850 Stonewater Dr Unit 92
- 2866 Stonewater Dr Unit 102
- 2511 Sheehan Dr Unit 203
- 2652 Charlestowne Ln
- 2543 Dewes Ln
- 2736 Bluewater Cir
- 3311 Fairmont Ave
- 3349 Rosecroft Ln Unit 2
- 2220 Waterleaf Ct Unit 204
- 2207 Sisters Ave
- 3408 Parliament Ln Unit 1
- 3003 Kingbird Ct Unit IV
- 3281 Cool Springs Ct
- 3316 Club Ct
- 2949 Brossman St
- 1512 Harbour Towne Place
- 2636 Salix Cir
- 2819 Normandy Cir
- 28W555 Leverenz Rd
- 2704 Cripple Creek Ct
- 2705 Cripple Creek Ct
- 2709 Cripple Creek Ct
- 2706 Cripple Creek Ct
- 2810 Alameda Ct
- 2715 Cedar Glade Rd
- 2711 Cedar Glade Rd
- 2717 Cedar Glade Rd
- 2812 Alameda Ct Unit 3
- 2711 Cripple Creek Ct Unit 3
- 2721 Cedar Glade Rd
- 2710 Cripple Creek Ct
- 2816 Alameda Ct
- 2723 Cedar Glade Rd Unit 3
- 2709 Cedar Glade Rd
- 2818 Alameda Ct
- 2818 Alameda Ct Unit 2818
- 2818 Alameda Ct Unit 2
- 2733 Cedar Glade Rd
- 2715 Cripple Creek Ct