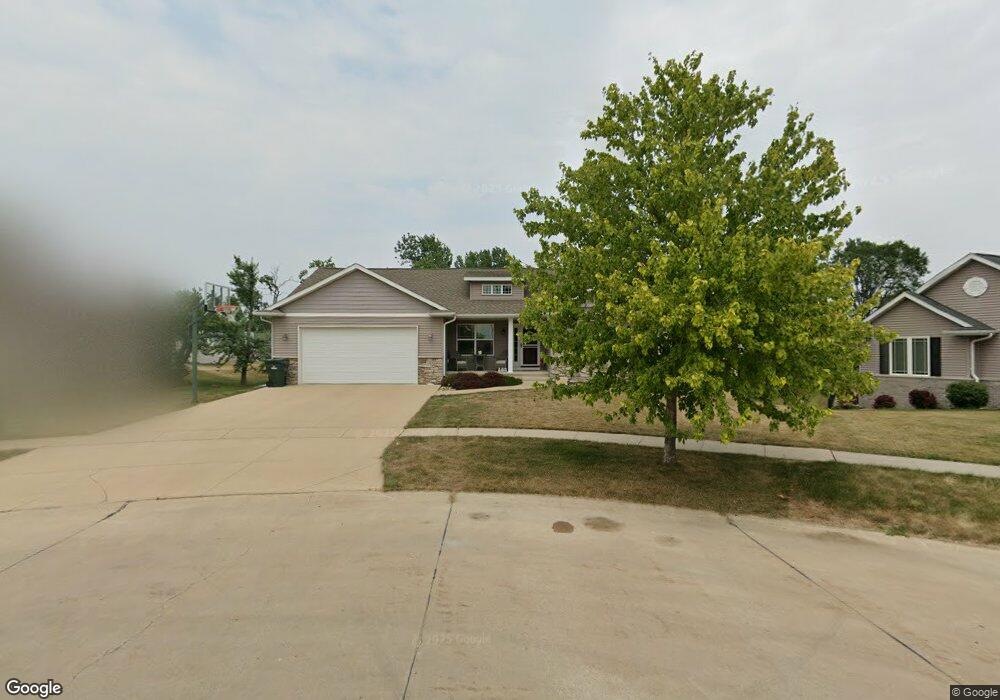
2703 Handley Ct SW Cedar Rapids, IA 52404
Southwest Area NeighborhoodEstimated Value: $272,000 - $344,398
3
Beds
3
Baths
1,439
Sq Ft
$217/Sq Ft
Est. Value
About This Home
This home is located at 2703 Handley Ct SW, Cedar Rapids, IA 52404 and is currently estimated at $312,850, approximately $217 per square foot. 2703 Handley Ct SW is a home located in Linn County with nearby schools including Junction City Elementary School, Grant Elementary School, and Bruce Hall Day Treatment Center.
Ownership History
Date
Name
Owned For
Owner Type
Purchase Details
Closed on
Sep 18, 2015
Sold by
Hopp Adam C and Hopp Lindy R
Bought by
Kitterman Christopher J and Kitterman Alice M
Current Estimated Value
Home Financials for this Owner
Home Financials are based on the most recent Mortgage that was taken out on this home.
Original Mortgage
$189,750
Outstanding Balance
$148,985
Interest Rate
3.9%
Mortgage Type
New Conventional
Estimated Equity
$163,865
Purchase Details
Closed on
Aug 31, 2010
Sold by
Johannes Brothers Construction Inc
Bought by
Hopp Adam C and Hopp Lindy R
Home Financials for this Owner
Home Financials are based on the most recent Mortgage that was taken out on this home.
Original Mortgage
$135,000
Interest Rate
4.54%
Mortgage Type
FHA
Purchase Details
Closed on
May 20, 2010
Sold by
Rb Development Inc
Bought by
Johannes Brothers Construction Inc
Home Financials for this Owner
Home Financials are based on the most recent Mortgage that was taken out on this home.
Original Mortgage
$31,834
Interest Rate
5.3%
Mortgage Type
Future Advance Clause Open End Mortgage
Create a Home Valuation Report for This Property
The Home Valuation Report is an in-depth analysis detailing your home's value as well as a comparison with similar homes in the area
Home Values in the Area
Average Home Value in this Area
Purchase History
| Date | Buyer | Sale Price | Title Company |
|---|---|---|---|
| Kitterman Christopher J | $223,500 | None Available | |
| Hopp Adam C | $180,000 | None Available | |
| Johannes Brothers Construction Inc | $31,500 | None Available |
Source: Public Records
Mortgage History
| Date | Status | Borrower | Loan Amount |
|---|---|---|---|
| Open | Kitterman Christopher J | $189,750 | |
| Previous Owner | Hopp Adam C | $135,000 | |
| Previous Owner | Hopp Adam C | $45,000 | |
| Previous Owner | Johannes Brothers Construction Inc | $31,834 |
Source: Public Records
Tax History Compared to Growth
Tax History
| Year | Tax Paid | Tax Assessment Tax Assessment Total Assessment is a certain percentage of the fair market value that is determined by local assessors to be the total taxable value of land and additions on the property. | Land | Improvement |
|---|---|---|---|---|
| 2025 | $5,222 | $304,600 | $54,300 | $250,300 |
| 2024 | $5,162 | $297,500 | $54,300 | $243,200 |
| 2023 | $5,162 | $305,500 | $54,300 | $251,200 |
| 2022 | $5,068 | $253,600 | $54,300 | $199,300 |
| 2021 | $5,476 | $253,600 | $54,300 | $199,300 |
| 2020 | $5,476 | $256,800 | $54,300 | $202,500 |
| 2019 | $5,536 | $256,800 | $54,300 | $202,500 |
| 2018 | $5,382 | $256,800 | $54,300 | $202,500 |
| 2017 | $4,788 | $219,900 | $54,300 | $165,600 |
| 2016 | $4,557 | $214,400 | $54,300 | $160,100 |
| 2015 | $4,587 | $215,533 | $54,288 | $161,245 |
| 2014 | $4,402 | $215,533 | $54,288 | $161,245 |
| 2013 | $4,302 | $215,533 | $54,288 | $161,245 |
Source: Public Records
Map
Nearby Homes
- 2212 Deborah Dr SW
- 2601 Teresa Dr SW
- 2401 Victoria Dr SW
- 51 29th Avenue Dr SW Unit D11
- 51 29th Avenue Dr SW Unit C22
- 2955 Bowling St SW Unit E238
- 42 Park Village Ave SW
- 3010 Bowling St SW
- 2937 Southland St SW
- 2818 Southland St SW
- 0 Rompot St SE
- 9 33rd Ave SW
- 3212 Southland St SW
- 2021 Hamilton St SW
- 186 22nd Ave SW
- 2448 2nd St SW
- 0 41st Avenue Dr SW Unit 202507355
- 0 41st Avenue Dr SW Unit 1 Ac
- 0 41st Avenue Dr SW Unit 2.25 Ac
- 148 33rd Ave SW
- 2711 Handley Ct SW
- 2711 Handley Ct SW
- 2617 Handley Dr SW
- 2617 Handley Ct SW
- 2609 Handley Ct SW
- 2720 Handley Ct SW
- 2708 Handley Ct SW
- 2720 Handley Ct SW
- 2702 Handley Ct SW
- 2511 Handley Dr SW
- 2601 Handley Dr SW
- 2519 Handley Dr SW
- 2503 Handley Dr SW
- 2618 Handley Dr SW
- 2435 Handley Dr SW
- 2429 Handley Dr SW
- 2612 Handley Dr SW
- 2428 C St SW
- 2423 Handley Dr SW
- 2454 C St SW