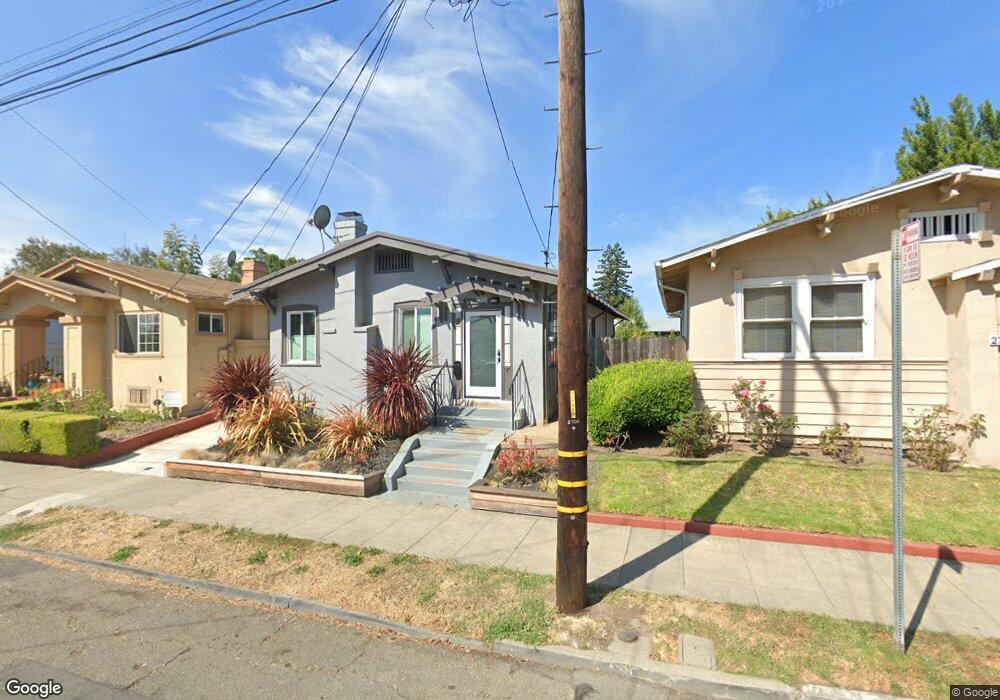
2704 Mabel St Berkeley, CA 94702
West Berkeley NeighborhoodEstimated Value: $982,000 - $1,292,000
2
Beds
2
Baths
955
Sq Ft
$1,229/Sq Ft
Est. Value
About This Home
This home is located at 2704 Mabel St, Berkeley, CA 94702 and is currently estimated at $1,173,568, approximately $1,228 per square foot. 2704 Mabel St is a home located in Alameda County with nearby schools including Malcolm X Elementary School, Washington Elementary School, and Oxford Elementary School.
Ownership History
Date
Name
Owned For
Owner Type
Purchase Details
Closed on
Apr 4, 2023
Sold by
Veen Allison and Veen Jesse
Bought by
Jesse Wilkins And Allison Veen Revocable Trus
Current Estimated Value
Purchase Details
Closed on
Feb 20, 2018
Sold by
Moore Kevin A
Bought by
Veen Allison and Wilkins Jesse
Purchase Details
Closed on
Feb 23, 2017
Sold by
Moore Monique
Bought by
Moore Kevin A
Home Financials for this Owner
Home Financials are based on the most recent Mortgage that was taken out on this home.
Original Mortgage
$354,000
Interest Rate
4.09%
Mortgage Type
Commercial
Purchase Details
Closed on
Apr 1, 1999
Sold by
Handy J L
Bought by
Handy J L and J L Handy Revocable Trust
Create a Home Valuation Report for This Property
The Home Valuation Report is an in-depth analysis detailing your home's value as well as a comparison with similar homes in the area
Home Values in the Area
Average Home Value in this Area
Purchase History
| Date | Buyer | Sale Price | Title Company |
|---|---|---|---|
| Jesse Wilkins And Allison Veen Revocable Trus | -- | None Listed On Document | |
| Veen Allison | $1,000,000 | Chicago Title Company | |
| Moore Kevin A | -- | Placer Title Company | |
| Moore Kevin A | $590,000 | Placer Title | |
| Handy J L | -- | -- |
Source: Public Records
Mortgage History
| Date | Status | Borrower | Loan Amount |
|---|---|---|---|
| Previous Owner | Moore Kevin A | $354,000 |
Source: Public Records
Tax History
| Year | Tax Paid | Tax Assessment Tax Assessment Total Assessment is a certain percentage of the fair market value that is determined by local assessors to be the total taxable value of land and additions on the property. | Land | Improvement |
|---|---|---|---|---|
| 2025 | $16,099 | $1,137,810 | $341,343 | $796,467 |
| 2024 | $16,099 | $1,115,500 | $334,650 | $780,850 |
| 2023 | $15,730 | $1,093,630 | $328,089 | $765,541 |
| 2022 | $15,438 | $1,072,190 | $321,657 | $750,533 |
| 2021 | $15,506 | $1,051,170 | $315,351 | $735,819 |
| 2020 | $14,833 | $1,040,400 | $312,120 | $728,280 |
| 2019 | $14,413 | $1,020,000 | $306,000 | $714,000 |
| 2018 | $9,310 | $601,800 | $180,540 | $421,260 |
| 2017 | $3,142 | $109,253 | $32,776 | $76,477 |
| 2016 | $2,978 | $107,111 | $32,133 | $74,978 |
| 2015 | $2,923 | $105,503 | $31,651 | $73,852 |
| 2014 | $2,871 | $103,436 | $31,031 | $72,405 |
Source: Public Records
Map
Nearby Homes
- 2717 Mabel St
- 1135 Parker St
- 1034 Grayson St
- 1450 Ward St
- 2758 Sacramento St
- 2750 Sacramento St
- 2774 Sacramento St
- 2782 Sacramento St
- 2790 Sacramento St
- 1142 Dwight Way
- 1144 Dwight Way
- 1118 Dwight Way
- 1010 Grayson St
- 1515 Derby St
- 1092 Dwight Way
- 1237 Ashby Ave
- 2922 Stanton St
- 1314 Ashby Ave
- 2829 California St
- 1612 Parker St
Your Personal Tour Guide
Ask me questions while you tour the home.