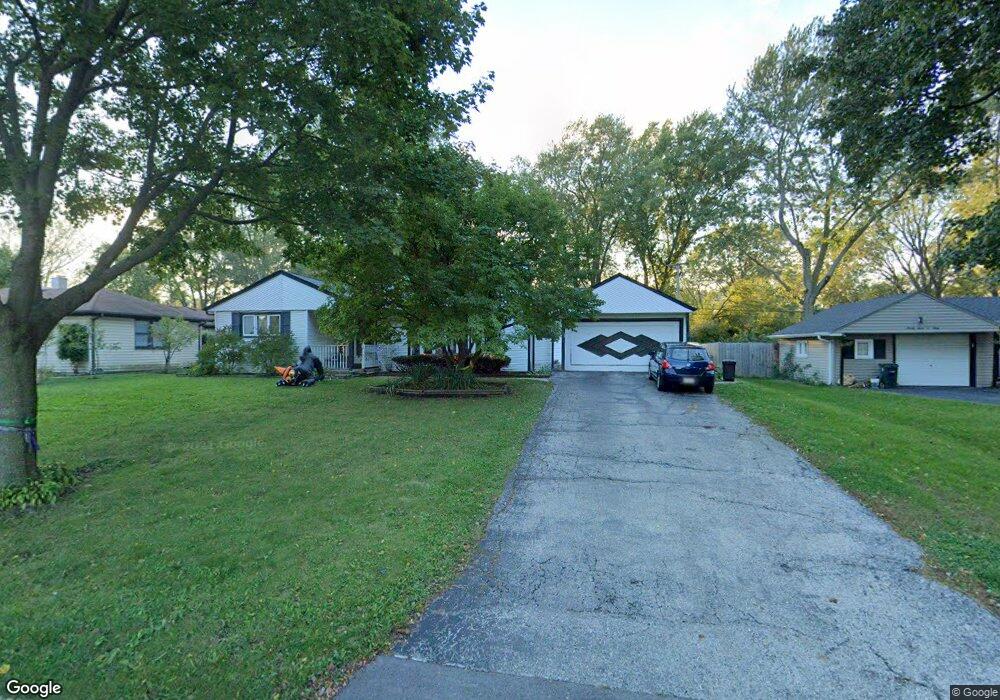
2705 Dove St Unit 1 Rolling Meadows, IL 60008
Estimated Value: $277,000 - $328,116
3
Beds
1
Bath
1,168
Sq Ft
$264/Sq Ft
Est. Value
About This Home
This home is located at 2705 Dove St Unit 1, Rolling Meadows, IL 60008 and is currently estimated at $307,779, approximately $263 per square foot. 2705 Dove St Unit 1 is a home located in Cook County with nearby schools including Kimball Hill Elementary School, King Elementary School, and Carl Sandburg Junior High School.
Ownership History
Date
Name
Owned For
Owner Type
Purchase Details
Closed on
Apr 28, 2011
Sold by
Federal National Mortgage Association
Bought by
Schuetz Lawrence and Schuetz Margaret
Current Estimated Value
Purchase Details
Closed on
Feb 9, 2011
Sold by
Owsiany Guy L
Bought by
Federal National Mortgage Association
Purchase Details
Closed on
Dec 26, 2000
Sold by
Murphy Mike and Murphy Gina
Bought by
Owsiany Guy L
Home Financials for this Owner
Home Financials are based on the most recent Mortgage that was taken out on this home.
Original Mortgage
$170,700
Interest Rate
7.77%
Purchase Details
Closed on
Jul 30, 1998
Sold by
Duhamel Margaret J
Bought by
Murphy Mike and Murphy Gina
Home Financials for this Owner
Home Financials are based on the most recent Mortgage that was taken out on this home.
Original Mortgage
$139,150
Interest Rate
6.99%
Create a Home Valuation Report for This Property
The Home Valuation Report is an in-depth analysis detailing your home's value as well as a comparison with similar homes in the area
Home Values in the Area
Average Home Value in this Area
Purchase History
| Date | Buyer | Sale Price | Title Company |
|---|---|---|---|
| Schuetz Lawrence | $122,000 | None Available | |
| Federal National Mortgage Association | -- | None Available | |
| Owsiany Guy L | $176,000 | -- | |
| Murphy Mike | $143,500 | Professional National Title |
Source: Public Records
Mortgage History
| Date | Status | Borrower | Loan Amount |
|---|---|---|---|
| Previous Owner | Owsiany Guy L | $170,700 | |
| Previous Owner | Murphy Mike | $139,150 |
Source: Public Records
Tax History Compared to Growth
Tax History
| Year | Tax Paid | Tax Assessment Tax Assessment Total Assessment is a certain percentage of the fair market value that is determined by local assessors to be the total taxable value of land and additions on the property. | Land | Improvement |
|---|---|---|---|---|
| 2024 | $8,275 | $27,000 | $5,511 | $21,489 |
| 2023 | $7,925 | $27,000 | $5,511 | $21,489 |
| 2022 | $7,925 | $27,000 | $5,511 | $21,489 |
| 2021 | $6,681 | $20,173 | $3,256 | $16,917 |
| 2020 | $6,523 | $20,173 | $3,256 | $16,917 |
| 2019 | $6,558 | $22,540 | $3,256 | $19,284 |
| 2018 | $6,589 | $20,344 | $3,006 | $17,338 |
| 2017 | $6,455 | $20,344 | $3,006 | $17,338 |
| 2016 | $6,014 | $20,344 | $3,006 | $17,338 |
| 2015 | $5,875 | $18,658 | $2,755 | $15,903 |
| 2014 | $5,734 | $18,658 | $2,755 | $15,903 |
| 2013 | $4,808 | $18,658 | $2,755 | $15,903 |
Source: Public Records
Map
Nearby Homes
- 1615 W Johanna Terrace
- 502 S Reuter Dr
- 2611 South St
- 2201 Kingfisher Ln
- 12 S Princeton Ct
- 2100 Martin Ln
- 3208 Wren Ln
- 222 S Dwyer Ave
- 3316 Trillium Cir
- 617 N Wilke Rd
- 3125 Town Square Dr Unit 408
- 3805 Wren Ln
- 3265 Kirchoff Rd Unit 223
- 3400 Wellington Ct Unit 306
- 3355 Kirchoff Rd Unit 6A
- 751 S Dwyer Ave Unit F
- 1506 W Northwest Hwy
- 2303 Fulle St
- 1602 W Orchard Place Unit 1602C
- 2503 Fulle St Unit 17