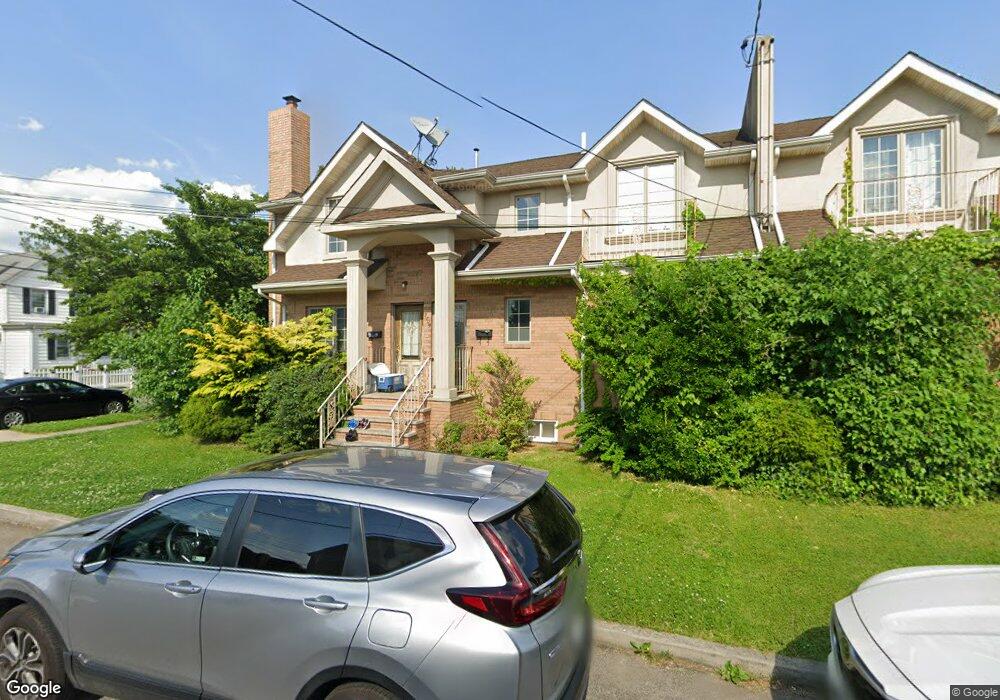
2705 Murray Ln Flushing, NY 11354
Murray Hill-Broadway NeighborhoodEstimated Value: $1,210,000 - $1,488,000
Studio
--
Bath
2,235
Sq Ft
$614/Sq Ft
Est. Value
About This Home
This home is located at 2705 Murray Ln, Flushing, NY 11354 and is currently estimated at $1,371,955, approximately $613 per square foot. 2705 Murray Ln is a home located in Queens County with nearby schools including P.S. 21 Edward Hart, Jhs 185 Edward Bleeker, and Flushing High School.
Ownership History
Date
Name
Owned For
Owner Type
Purchase Details
Closed on
Apr 30, 2007
Sold by
Asherian Noorollah and Eliakamal Sima
Bought by
Ame Llc and Yang Hui
Current Estimated Value
Home Financials for this Owner
Home Financials are based on the most recent Mortgage that was taken out on this home.
Original Mortgage
$250,000
Outstanding Balance
$150,155
Interest Rate
6.21%
Estimated Equity
$1,221,800
Purchase Details
Closed on
Nov 10, 2004
Sold by
Sudol and Beth
Bought by
Asherian Noorollah and Eliakamal Sima
Home Financials for this Owner
Home Financials are based on the most recent Mortgage that was taken out on this home.
Original Mortgage
$581,250
Interest Rate
5.75%
Mortgage Type
Purchase Money Mortgage
Purchase Details
Closed on
Mar 21, 2001
Sold by
Deinnocentiis Nicolo and De Innocentiis Joanna
Bought by
Sudol Henry and Sudol Beth
Home Financials for this Owner
Home Financials are based on the most recent Mortgage that was taken out on this home.
Original Mortgage
$305,000
Interest Rate
6.9%
Mortgage Type
Purchase Money Mortgage
Create a Home Valuation Report for This Property
The Home Valuation Report is an in-depth analysis detailing your home's value as well as a comparison with similar homes in the area
Home Values in the Area
Average Home Value in this Area
Purchase History
| Date | Buyer | Sale Price | Title Company |
|---|---|---|---|
| Ame Llc | -- | -- | |
| Lam Yik | $825,000 | -- | |
| Ame Llc | -- | -- | |
| Lam Yik | $825,000 | -- | |
| Ame Llc | -- | -- | |
| Asherian Noorollah | $775,000 | -- | |
| Asherian Noorollah | $775,000 | -- | |
| Asherian Noorollah | $775,000 | -- | |
| Sudol Henry | -- | -- | |
| Sudol Henry | -- | -- |
Source: Public Records
Mortgage History
| Date | Status | Borrower | Loan Amount |
|---|---|---|---|
| Open | Lam Yik | $250,000 | |
| Closed | Lam Yik | $250,000 | |
| Closed | Ame Llc | $0 | |
| Closed | Lam Yik | $330,000 | |
| Closed | Ame Llc | $0 | |
| Previous Owner | Asherian Noorollah | $581,250 | |
| Previous Owner | Sudol Henry | $305,000 |
Source: Public Records
Tax History
| Year | Tax Paid | Tax Assessment Tax Assessment Total Assessment is a certain percentage of the fair market value that is determined by local assessors to be the total taxable value of land and additions on the property. | Land | Improvement |
|---|---|---|---|---|
| 2025 | $11,438 | $57,379 | $19,270 | $38,109 |
| 2024 | $11,438 | $56,950 | $17,965 | $38,985 |
| 2023 | $11,136 | $55,444 | $17,779 | $37,665 |
| 2022 | $8,044 | $87,840 | $26,820 | $61,020 |
| 2021 | $10,666 | $81,600 | $26,820 | $54,780 |
| 2020 | $9,825 | $84,480 | $26,820 | $57,660 |
| 2019 | $9,635 | $90,180 | $26,820 | $63,360 |
| 2018 | $9,121 | $46,203 | $17,990 | $28,213 |
| 2017 | $8,827 | $44,770 | $19,639 | $25,131 |
| 2016 | $8,134 | $44,770 | $19,639 | $25,131 |
| 2015 | $4,874 | $39,847 | $25,753 | $14,094 |
| 2014 | $4,874 | $39,549 | $22,671 | $16,878 |
Source: Public Records
Map
Nearby Homes
- 15016 26th Ave
- 25-47 150th St
- 151-23 26th Ave
- 151-67 27th Ave
- 30-27 Murray Ln
- 151-65 26th Ave
- 151-28 24th Rd
- 30-11 149th St
- 150-38 24th Ave
- 32-15 Murray Ln
- 154-19 26th Ave
- 154-28 27th Ave
- 15428 27th Ave
- 153-06 32nd Ave
- 154-07 24th Rd
- 154-43 25th Dr
- 154-24 27th Ave
- 28-14 157th St
- 14708 32nd Ave
- 3307 153rd St
- 27-05 Murray Ln Unit 1st FL
- 2707 Murray Ln
- 15050 27th Ave
- 15050 27th Ave
- 15034 27th Ave
- 2710 Murray St
- 15043 27th Ave
- 2714 Murray St
- 15043 28th Ave
- 15045 28th Ave
- 15043 27th Ave
- 15041 27th Ave
- 15030 27th Ave
- 15049 27th Ave
- 15030 27th Ave Unit 2nd Fl
- 15055 28th Ave
- 15035 28th Ave
- 15031 27th Ave
- 15035 28th Ave
- 15035 28th Ave Unit 2Fl
Your Personal Tour Guide
Ask me questions while you tour the home.