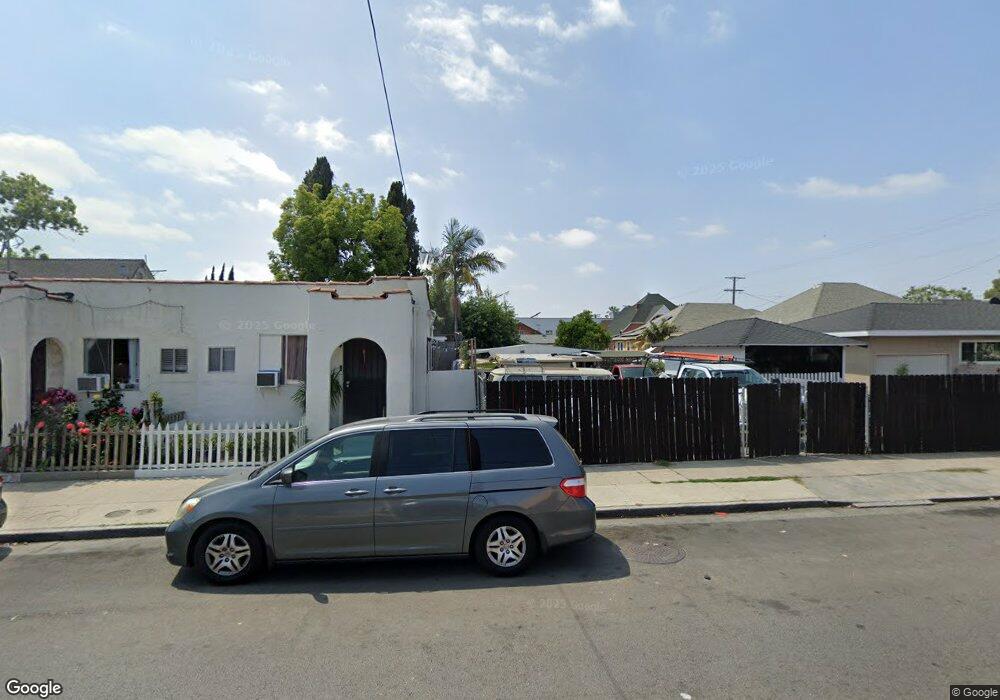
2705 Trinity St Los Angeles, CA 90011
Historic South Central NeighborhoodEstimated Value: $755,018 - $781,000
6
Beds
4
Baths
3,071
Sq Ft
$250/Sq Ft
Est. Value
About This Home
This home is located at 2705 Trinity St, Los Angeles, CA 90011 and is currently estimated at $769,255, approximately $250 per square foot. 2705 Trinity St is a home located in Los Angeles County with nearby schools including Twenty-Eighth Street Elementary School, John Adams Middle School, and Santee Education Complex.
Ownership History
Date
Name
Owned For
Owner Type
Purchase Details
Closed on
Apr 7, 2023
Sold by
Lee Susie M
Bought by
Eng Family Trust
Current Estimated Value
Purchase Details
Closed on
Aug 22, 2020
Sold by
Fong Dennis King
Bought by
Fong Dennis K and Fong Family Trust
Purchase Details
Closed on
Nov 23, 2010
Sold by
Quon Jane Woo and Yuok Tong Woo Revocable Trust
Bought by
King Lee Susie M and King Fong Dennis
Purchase Details
Closed on
Jun 23, 1995
Sold by
Woo Yuok Tong
Bought by
Woo Yuok Tong and The Yuok Tong Woo Revocable Tr
Create a Home Valuation Report for This Property
The Home Valuation Report is an in-depth analysis detailing your home's value as well as a comparison with similar homes in the area
Home Values in the Area
Average Home Value in this Area
Purchase History
| Date | Buyer | Sale Price | Title Company |
|---|---|---|---|
| Eng Family Trust | -- | None Listed On Document | |
| Fong Dennis K | -- | None Available | |
| King Lee Susie M | -- | None Available | |
| Woo Yuok Tong | -- | -- |
Source: Public Records
Tax History
| Year | Tax Paid | Tax Assessment Tax Assessment Total Assessment is a certain percentage of the fair market value that is determined by local assessors to be the total taxable value of land and additions on the property. | Land | Improvement |
|---|---|---|---|---|
| 2025 | $1,111 | $47,491 | $19,331 | $28,160 |
| 2024 | $1,111 | $46,560 | $18,952 | $27,608 |
| 2023 | $1,100 | $45,648 | $18,581 | $27,067 |
| 2022 | $1,066 | $44,754 | $18,217 | $26,537 |
| 2021 | $1,037 | $43,877 | $17,860 | $26,017 |
| 2020 | $1,038 | $43,428 | $17,677 | $25,751 |
| 2019 | $1,017 | $42,578 | $17,331 | $25,247 |
| 2018 | $911 | $41,744 | $16,992 | $24,752 |
| 2016 | $840 | $40,125 | $16,333 | $23,792 |
| 2015 | $833 | $39,523 | $16,088 | $23,435 |
| 2014 | $865 | $38,749 | $15,773 | $22,976 |
Source: Public Records
Map
Nearby Homes
Your Personal Tour Guide
Ask me questions while you tour the home.