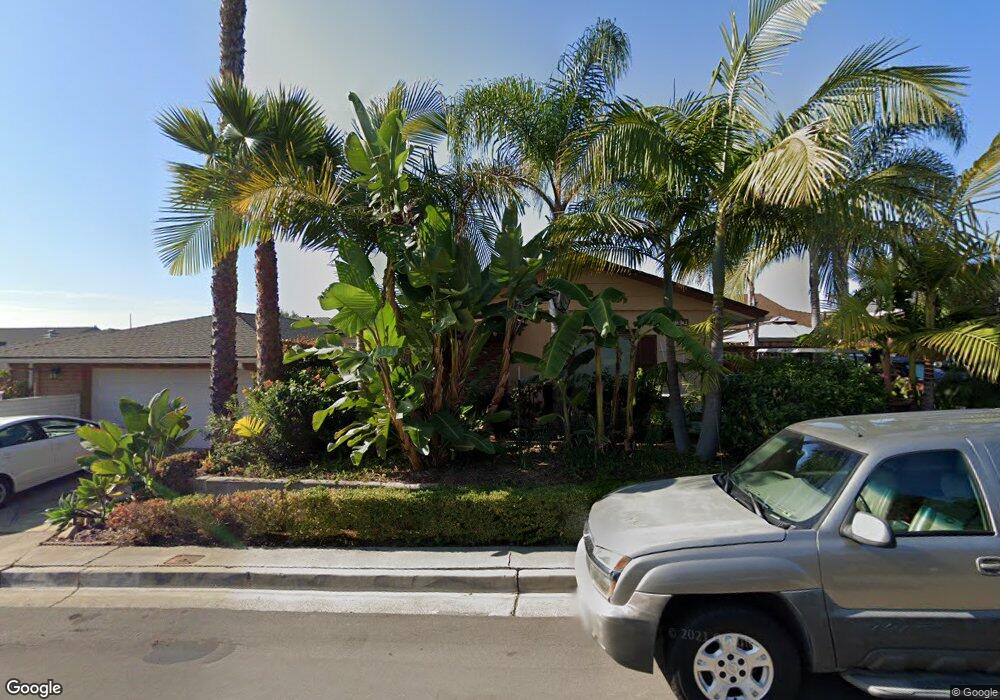
2705 Via Verbena San Clemente, CA 92672
Estimated Value: $1,438,000 - $1,976,000
4
Beds
3
Baths
1,800
Sq Ft
$933/Sq Ft
Est. Value
About This Home
This home is located at 2705 Via Verbena, San Clemente, CA 92672 and is currently estimated at $1,679,503, approximately $933 per square foot. 2705 Via Verbena is a home located in Orange County with nearby schools including Marblehead Elementary School, Shorecliffs Middle School, and San Clemente High School.
Ownership History
Date
Name
Owned For
Owner Type
Purchase Details
Closed on
Jun 15, 2023
Sold by
Rifenberg Timothy S
Bought by
Trust Of Timothy S Rifenberg
Current Estimated Value
Purchase Details
Closed on
Apr 21, 2003
Sold by
Strople Daniel J and Strople Ruth I
Bought by
Rifenberg Timothy S
Home Financials for this Owner
Home Financials are based on the most recent Mortgage that was taken out on this home.
Original Mortgage
$390,166
Interest Rate
4.85%
Mortgage Type
Purchase Money Mortgage
Purchase Details
Closed on
Oct 24, 1996
Sold by
Dimmick William H and Dimmick Bernice F
Bought by
Strople Daniel J
Create a Home Valuation Report for This Property
The Home Valuation Report is an in-depth analysis detailing your home's value as well as a comparison with similar homes in the area
Home Values in the Area
Average Home Value in this Area
Purchase History
| Date | Buyer | Sale Price | Title Company |
|---|---|---|---|
| Trust Of Timothy S Rifenberg | -- | None Listed On Document | |
| Rifenberg Timothy S | $430,000 | First American Title Ins Co | |
| Strople Daniel J | $200,000 | -- |
Source: Public Records
Mortgage History
| Date | Status | Borrower | Loan Amount |
|---|---|---|---|
| Previous Owner | Rifenberg Timothy S | $390,166 |
Source: Public Records
Tax History Compared to Growth
Tax History
| Year | Tax Paid | Tax Assessment Tax Assessment Total Assessment is a certain percentage of the fair market value that is determined by local assessors to be the total taxable value of land and additions on the property. | Land | Improvement |
|---|---|---|---|---|
| 2025 | $6,321 | $635,228 | $512,800 | $122,428 |
| 2024 | $6,321 | $622,773 | $502,745 | $120,028 |
| 2023 | $6,188 | $610,562 | $492,887 | $117,675 |
| 2022 | $6,070 | $598,591 | $483,223 | $115,368 |
| 2021 | $5,953 | $586,854 | $473,748 | $113,106 |
| 2020 | $5,894 | $580,837 | $468,890 | $111,947 |
| 2019 | $5,778 | $569,449 | $459,697 | $109,752 |
| 2018 | $5,667 | $558,284 | $450,684 | $107,600 |
| 2017 | $5,557 | $547,338 | $441,847 | $105,491 |
| 2016 | $5,450 | $536,606 | $433,183 | $103,423 |
| 2015 | $5,368 | $528,546 | $426,676 | $101,870 |
| 2014 | $5,265 | $518,193 | $418,318 | $99,875 |
Source: Public Records
Map
Nearby Homes
- 235 Via Ballena
- 259 Via Ballena
- 263 Via Ballena
- 212 Via Socorro
- 408 Camino San Clemente
- 503 Ebb Tide Dr
- 404 Ebb Tide Dr
- 2820 Camino Capistrano Unit D
- 114 Shell Dr
- 508 Ebb Tide Dr
- 103 Monte Vista
- 106 Pacific Dr
- 157 Camino San Clemente
- 101 Via Artemesia
- 2903 Camino Capistrano
- 2924 Camino Capistrano Unit 7A
- 210 Del Gado Rd
- 522 Calle Cuadra
- 503 Calle Amigo
- 35767 Beach Rd
- 2703 Via Verbena
- 2707 Via Verbena
- 2709 Via Verbena
- 2701 Via Verbena
- 2705 Via Montecito
- 2703 Via Vistosa
- 2705 Via Vistosa
- 2707 Via Montecito
- 2701 Via Vistosa
- 2703 Via Montecito
- 2707 Via Vistosa
- 2711 Via Verbena
- 2709 Via Montecito
- 2709 Via Vistosa
- 2701 Via Montecito
- 2711 Via Montecito
- 2713 Via Verbena
- 2711 Via Vistosa
- 306 Via Alegre
- 308 Via Alegre