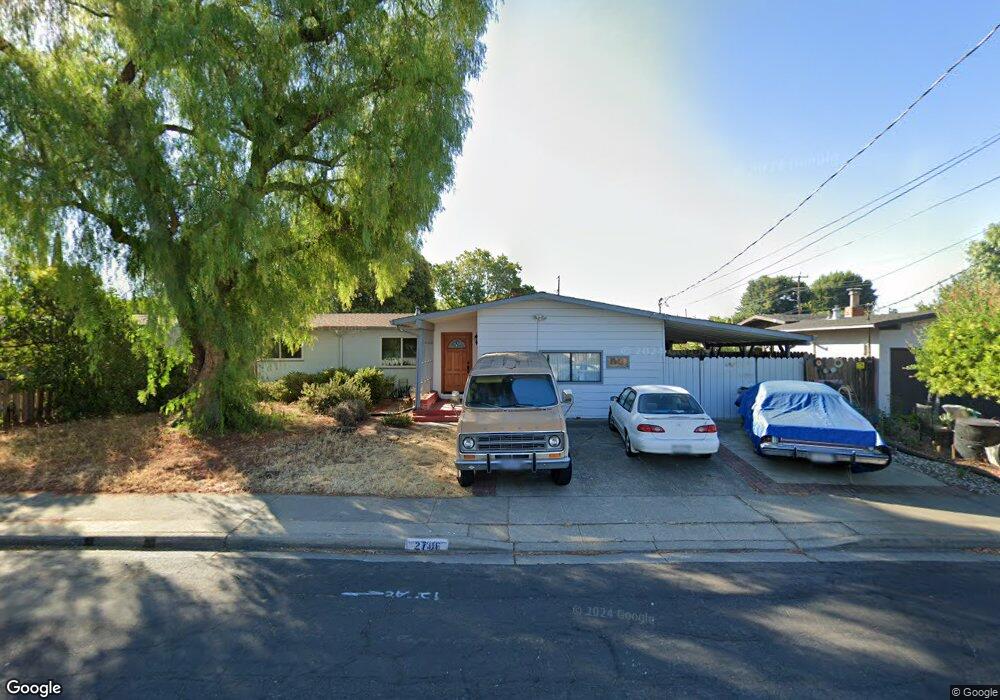
2706 Argyll Ave Concord, CA 94520
Buchanan Field NeighborhoodEstimated Value: $599,000 - $729,000
3
Beds
1
Bath
1,146
Sq Ft
$559/Sq Ft
Est. Value
About This Home
This home is located at 2706 Argyll Ave, Concord, CA 94520 and is currently estimated at $640,776, approximately $559 per square foot. 2706 Argyll Ave is a home located in Contra Costa County with nearby schools including Holbrook Language Academy, Valley View Middle School, and Mt. Diablo High School.
Ownership History
Date
Name
Owned For
Owner Type
Purchase Details
Closed on
Dec 27, 2023
Sold by
Narvaez Olivia and Narvaez Ricardo E
Bought by
Narvaez Family 2023 Living Trust and Narvaez
Current Estimated Value
Purchase Details
Closed on
May 18, 2012
Sold by
Narvaez Olivia and Narvaez Ricardo E
Bought by
Narvaez Olivia and Narvaez Ricardo E
Home Financials for this Owner
Home Financials are based on the most recent Mortgage that was taken out on this home.
Original Mortgage
$157,000
Interest Rate
3.85%
Mortgage Type
New Conventional
Purchase Details
Closed on
Oct 27, 2000
Sold by
Omran Fuad N and Omran Carmen R
Bought by
Narvaez Ricardo and Narvaez Olivia
Home Financials for this Owner
Home Financials are based on the most recent Mortgage that was taken out on this home.
Original Mortgage
$206,000
Interest Rate
7.89%
Mortgage Type
Purchase Money Mortgage
Create a Home Valuation Report for This Property
The Home Valuation Report is an in-depth analysis detailing your home's value as well as a comparison with similar homes in the area
Home Values in the Area
Average Home Value in this Area
Purchase History
| Date | Buyer | Sale Price | Title Company |
|---|---|---|---|
| Narvaez Family 2023 Living Trust | -- | None Listed On Document | |
| Narvaez Olivia | -- | Chicago Title Company | |
| Narvaez Ricardo | $217,000 | Commonwealth Land Title Co |
Source: Public Records
Mortgage History
| Date | Status | Borrower | Loan Amount |
|---|---|---|---|
| Previous Owner | Narvaez Olivia | $157,000 | |
| Previous Owner | Narvaez Ricardo | $206,000 |
Source: Public Records
Tax History
| Year | Tax Paid | Tax Assessment Tax Assessment Total Assessment is a certain percentage of the fair market value that is determined by local assessors to be the total taxable value of land and additions on the property. | Land | Improvement |
|---|---|---|---|---|
| 2025 | $4,543 | $326,959 | $150,673 | $176,286 |
| 2024 | $4,415 | $320,549 | $147,719 | $172,830 |
| 2023 | $4,316 | $314,265 | $144,823 | $169,442 |
| 2022 | $4,242 | $308,104 | $141,984 | $166,120 |
| 2021 | $4,126 | $302,063 | $139,200 | $162,863 |
| 2019 | $4,036 | $293,106 | $135,072 | $158,034 |
| 2018 | $3,874 | $287,360 | $132,424 | $154,936 |
| 2017 | $3,735 | $281,727 | $129,828 | $151,899 |
| 2016 | $3,613 | $276,204 | $127,283 | $148,921 |
| 2015 | $3,552 | $272,057 | $125,372 | $146,685 |
| 2014 | $3,295 | $251,000 | $115,669 | $135,331 |
Source: Public Records
Map
Nearby Homes
- 2719 Edward Ave
- 2831 Richard Ave
- 2819 Kay Ave
- 2766 Argyll Ave
- 2780 Argyll Ave
- 2102 Overhill Rd
- 2917 Knoll Dr
- 2719 Grant St
- 2868 Avon Ave
- 1838 Overhill Rd
- 2219 Acacia Dr
- 2829 Hilltop Rd
- 2653 Garden Ave
- 3185 Claudia Dr
- 2067 Olivera Rd Unit B
- 1975 Bonifacio St Unit 5
- 2069 Olivera Rd Unit E
- 1971 Bonifacio St Unit 3
- 3179 Meadowbrook Dr
- 2097 Dalis Dr Unit 79
- 2700 Argyll Ave
- 2712 Argyll Ave
- 2707 Edward Ave
- 2701 Edward Ave
- 2713 Edward Ave
- 2707 Argyll Ave
- 2718 Argyll Ave
- 2701 Argyll Ave
- 2713 Argyll Ave
- 2785 Richard Ave
- 2719 Argyll Ave
- 2724 Argyll Ave
- 2725 Edward Ave
- 2706 Kay Ave Unit 1
- 2773 Richard Ave
- 2801 Richard Ave
- 2806 Richard Ave
- 2700 Edward Ave
- 2712 Edward Ave
- 2712 Kay Ave
Your Personal Tour Guide
Ask me questions while you tour the home.