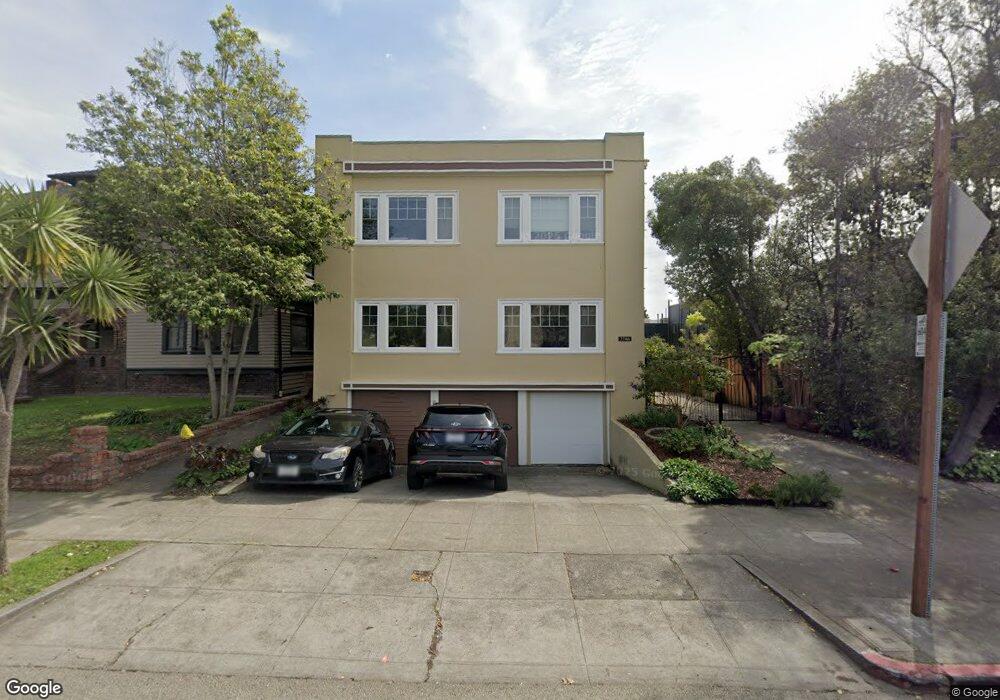
2706 Ashby Ave Unit 4 Berkeley, CA 94705
Elmwood NeighborhoodEstimated Value: $744,000 - $1,338,000
1
Bed
1
Bath
796
Sq Ft
$1,193/Sq Ft
Est. Value
About This Home
This home is located at 2706 Ashby Ave Unit 4, Berkeley, CA 94705 and is currently estimated at $949,971, approximately $1,193 per square foot. 2706 Ashby Ave Unit 4 is a home located in Alameda County with nearby schools including Emerson Elementary School, John Muir Elementary School, and Malcolm X Elementary School.
Ownership History
Date
Name
Owned For
Owner Type
Purchase Details
Closed on
Jun 20, 2012
Sold by
Margolis Jay L and Margolis Julie F
Bought by
Elkin Eric P
Current Estimated Value
Home Financials for this Owner
Home Financials are based on the most recent Mortgage that was taken out on this home.
Original Mortgage
$396,000
Outstanding Balance
$273,280
Interest Rate
3.74%
Mortgage Type
New Conventional
Estimated Equity
$676,691
Purchase Details
Closed on
Jul 16, 2009
Sold by
Otto Elliott F
Bought by
Margolis Jay L and Margolis Julie F
Purchase Details
Closed on
Jan 19, 2001
Sold by
Lizondo Manuel Roberto
Bought by
Otto Elliott F
Purchase Details
Closed on
Jan 18, 2001
Sold by
Leong Jick G and Etal Alice N Trs
Bought by
Lizondo Manuel Roberto
Purchase Details
Closed on
Feb 4, 1999
Sold by
Leong Jick G and Leong Alice N
Bought by
Ng Leong Jick G and Ng Leong Alice
Purchase Details
Closed on
Dec 20, 1994
Sold by
Swanson Dawn J
Bought by
Lizondo Manuel Roberto
Create a Home Valuation Report for This Property
The Home Valuation Report is an in-depth analysis detailing your home's value as well as a comparison with similar homes in the area
Home Values in the Area
Average Home Value in this Area
Purchase History
| Date | Buyer | Sale Price | Title Company |
|---|---|---|---|
| Elkin Eric P | $495,000 | Chicago Title Company | |
| Margolis Jay L | $488,000 | Old Republic Title Company | |
| Otto Elliott F | $352,000 | Placer Title Company | |
| Lizondo Manuel Roberto | -- | Placer Title Company | |
| Ng Leong Jick G | -- | -- | |
| Lizondo Manuel Roberto | -- | Placer Title Company |
Source: Public Records
Mortgage History
| Date | Status | Borrower | Loan Amount |
|---|---|---|---|
| Open | Elkin Eric P | $396,000 |
Source: Public Records
Tax History
| Year | Tax Paid | Tax Assessment Tax Assessment Total Assessment is a certain percentage of the fair market value that is determined by local assessors to be the total taxable value of land and additions on the property. | Land | Improvement |
|---|---|---|---|---|
| 2025 | $9,395 | $614,714 | $186,514 | $435,200 |
| 2024 | $9,395 | $602,527 | $182,858 | $426,669 |
| 2023 | $9,199 | $597,578 | $179,273 | $418,305 |
| 2022 | $9,034 | $578,861 | $175,758 | $410,103 |
| 2021 | $9,055 | $567,377 | $172,313 | $402,064 |
| 2020 | $8,581 | $568,491 | $170,547 | $397,944 |
| 2019 | $8,255 | $557,350 | $167,205 | $390,145 |
| 2018 | $8,117 | $546,424 | $163,927 | $382,497 |
| 2017 | $7,828 | $535,713 | $160,714 | $374,999 |
| 2016 | $7,581 | $525,208 | $157,562 | $367,646 |
| 2015 | $7,481 | $517,324 | $155,197 | $362,127 |
| 2014 | $7,431 | $507,191 | $152,157 | $355,034 |
Source: Public Records
Map
Nearby Homes
- 2962 Piedmont Ave
- 2643 Stuart St
- 2477 Prince St
- 2817 Palm Ct
- 2935 Florence St
- 2917 Telegraph Ave
- 6446 Colby St
- 360 Alcatraz Ave
- 2632 Warring St Unit 3
- 2601 College Ave Unit 203
- 2601 College Ave Unit 208
- 2243 Ashby Ave
- 2702 Dana St
- 2319 Ward St
- 3046 Deakin St
- 2535 Chilton Way
- 6445 Irwin Ct
- 190 Stonewall Rd
- 2923 Wheeler St
- 2550 Dana St Unit 2F
- 2706 Ashby Ave Unit 3
- 2706 Ashby Ave Unit 2
- 2706 Ashby Ave Unit 1
- 2987 College Ave
- 2726 Elmwood Ave
- 2644 Ashby Ave
- 2729 Elmwood Ave
- 2728 Elmwood Ave
- 2974-2980 College Ave
- 2725 Elmwood Ave
- 2986 College Ave
- 2721 Ashby Place
- 2992 College Ave
- 2952 College Ave Unit 2
- 2732 Elmwood Ave
- 2734 Ashby Place
- 2941 College Ave
- 2717 Webster St
- 2641 Webster St
- 2641 Webster St Unit 4
Your Personal Tour Guide
Ask me questions while you tour the home.