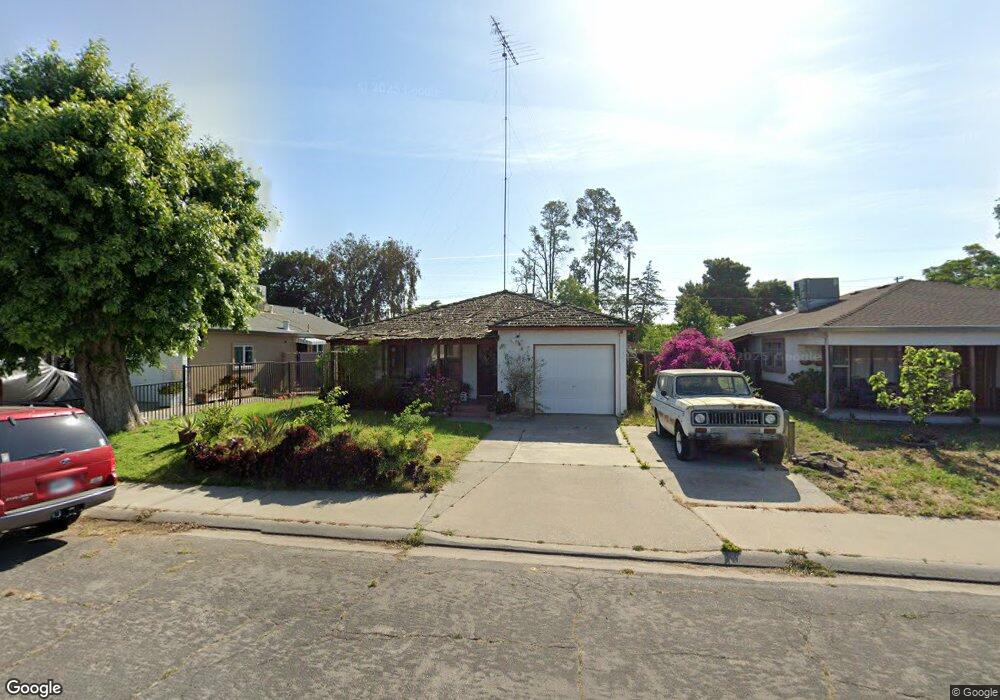
2708 Whitcomb Way Modesto, CA 95350
Estimated Value: $335,006 - $357,000
3
Beds
1
Bath
1,066
Sq Ft
$326/Sq Ft
Est. Value
About This Home
This home is located at 2708 Whitcomb Way, Modesto, CA 95350 and is currently estimated at $348,002, approximately $326 per square foot. 2708 Whitcomb Way is a home located in Stanislaus County with nearby schools including Josephine Chrysler Elementary School, Prescott Junior High School, and Grace M. Davis High School.
Ownership History
Date
Name
Owned For
Owner Type
Purchase Details
Closed on
Aug 25, 2022
Sold by
Stanley Peek Douglas
Bought by
Peek Douglas Stanley and Peek Sheri L
Current Estimated Value
Home Financials for this Owner
Home Financials are based on the most recent Mortgage that was taken out on this home.
Original Mortgage
$169,000
Outstanding Balance
$160,964
Interest Rate
5.22%
Mortgage Type
New Conventional
Estimated Equity
$187,038
Purchase Details
Closed on
Nov 13, 2000
Sold by
Stanley Peek Douglas S and Stanley Douglas
Bought by
Peek Douglas Stanley
Home Financials for this Owner
Home Financials are based on the most recent Mortgage that was taken out on this home.
Original Mortgage
$72,000
Interest Rate
7.82%
Purchase Details
Closed on
Nov 10, 2000
Sold by
Peek Virginia
Bought by
Peek Douglas Stanley
Home Financials for this Owner
Home Financials are based on the most recent Mortgage that was taken out on this home.
Original Mortgage
$72,000
Interest Rate
7.82%
Create a Home Valuation Report for This Property
The Home Valuation Report is an in-depth analysis detailing your home's value as well as a comparison with similar homes in the area
Purchase History
| Date | Buyer | Sale Price | Title Company |
|---|---|---|---|
| Peek Douglas Stanley | -- | American Coast Title | |
| Peek Douglas Stanley | -- | Stewart Title | |
| Peek Douglas Stanley | -- | Stewart Title |
Source: Public Records
Mortgage History
| Date | Status | Borrower | Loan Amount |
|---|---|---|---|
| Open | Peek Douglas Stanley | $169,000 | |
| Previous Owner | Peek Douglas Stanley | $72,000 |
Source: Public Records
Tax History
| Year | Tax Paid | Tax Assessment Tax Assessment Total Assessment is a certain percentage of the fair market value that is determined by local assessors to be the total taxable value of land and additions on the property. | Land | Improvement |
|---|---|---|---|---|
| 2025 | $998 | $93,563 | $33,835 | $59,728 |
| 2024 | $961 | $91,729 | $33,172 | $58,557 |
| 2023 | $942 | $89,931 | $32,522 | $57,409 |
| 2022 | $915 | $88,169 | $31,885 | $56,284 |
| 2021 | $863 | $86,441 | $31,260 | $55,181 |
| 2020 | $851 | $85,556 | $30,940 | $54,616 |
| 2019 | $839 | $83,880 | $30,334 | $53,546 |
| 2018 | $828 | $82,237 | $29,740 | $52,497 |
| 2017 | $807 | $80,625 | $29,157 | $51,468 |
| 2016 | $784 | $79,045 | $28,586 | $50,459 |
| 2015 | $777 | $77,859 | $28,157 | $49,702 |
| 2014 | $767 | $76,335 | $27,606 | $48,729 |
Source: Public Records
Map
Nearby Homes
- 2724 Sparks Way
- 2312 St James Place
- 3000 Tigerlily Ct
- 3004 Woodrose Ct
- 2134 Whitcomb Way
- 2212 Palisade Ave
- 2621 Prescott Rd Unit 189
- 2621 Prescott Rd Unit 79
- 2621 Prescott Rd Unit 17
- 2621 Prescott Rd Unit 277
- 2621 Prescott Rd Unit 262
- 2621 Prescott Rd Unit 37
- 2621 Prescott Rd Unit 40
- 2621 Prescott Rd Unit 92
- 2621 Prescott Rd Unit 246
- 2137 Chrysler Dr
- 2504 Bridle Path Ln
- 3037 Holiday Ln
- 2165 Sharon Way
- 2501 Prescott Rd
- 2712 Whitcomb Way
- 2704 Whitcomb Way
- 2716 Whitcomb Way
- 2700 Whitcomb Way
- 2720 Whitcomb Way
- 2616 Whitcomb Way
- 2709 Whitcomb Way
- 2713 Whitcomb Way
- 2705 Whitcomb Way
- 2724 Whitcomb Way
- 2612 Whitcomb Way
- 2717 Whitcomb Way
- 2701 Whitcomb Way
- 2721 Whitcomb Way
- 2617 Whitcomb Way
- 2608 Whitcomb Way
- 2725 Whitcomb Way
- 2613 Whitcomb Way
- 2500 Brenner Way
- 2604 Whitcomb Way
Your Personal Tour Guide
Ask me questions while you tour the home.