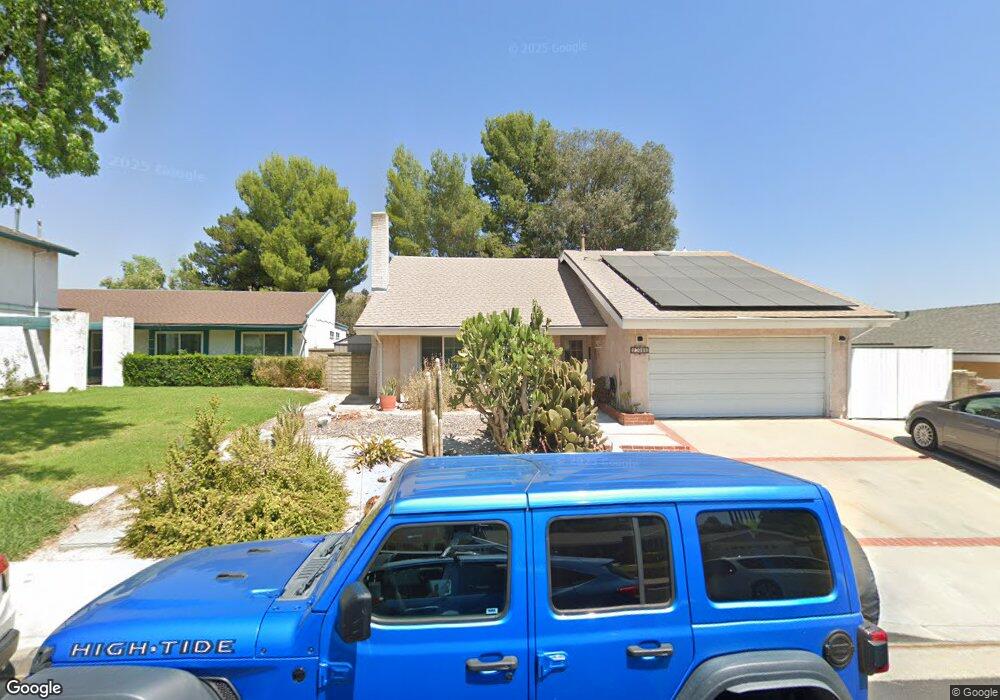
27086 Las Mananitas Dr Valencia, CA 91354
Estimated Value: $828,000 - $897,000
4
Beds
3
Baths
1,836
Sq Ft
$470/Sq Ft
Est. Value
About This Home
This home is located at 27086 Las Mananitas Dr, Valencia, CA 91354 and is currently estimated at $863,145, approximately $470 per square foot. 27086 Las Mananitas Dr is a home located in Los Angeles County with nearby schools including Santa Clarita Elementary School, Arroyo Seco Junior High School, and Saugus High School.
Ownership History
Date
Name
Owned For
Owner Type
Purchase Details
Closed on
Jun 15, 2017
Sold by
Uribe James
Bought by
Uribe Gustavo and Uribe Glorra
Current Estimated Value
Purchase Details
Closed on
May 23, 1995
Sold by
Emc Mtg Corp
Bought by
Kovacs Leslie T and Kovacs Peggy
Home Financials for this Owner
Home Financials are based on the most recent Mortgage that was taken out on this home.
Original Mortgage
$171,000
Interest Rate
7.92%
Purchase Details
Closed on
Apr 3, 1995
Sold by
Great Western Bank Fsb
Bought by
Emc Mtg Corp
Home Financials for this Owner
Home Financials are based on the most recent Mortgage that was taken out on this home.
Original Mortgage
$171,000
Interest Rate
7.92%
Purchase Details
Closed on
Feb 24, 1995
Sold by
Taylor Laurel Pharr and Great Western Bank Fsb
Bought by
Great Western Bank Fsb
Create a Home Valuation Report for This Property
The Home Valuation Report is an in-depth analysis detailing your home's value as well as a comparison with similar homes in the area
Home Values in the Area
Average Home Value in this Area
Purchase History
| Date | Buyer | Sale Price | Title Company |
|---|---|---|---|
| Uribe Gustavo | -- | None Available | |
| Kovacs Leslie T | $190,000 | Chicago Title Co | |
| Emc Mtg Corp | $138,000 | Chicago Title Insurance Co | |
| Great Western Bank Fsb | $155,586 | Chicago Title Company |
Source: Public Records
Mortgage History
| Date | Status | Borrower | Loan Amount |
|---|---|---|---|
| Closed | Kovacs Leslie T | $171,000 |
Source: Public Records
Tax History Compared to Growth
Tax History
| Year | Tax Paid | Tax Assessment Tax Assessment Total Assessment is a certain percentage of the fair market value that is determined by local assessors to be the total taxable value of land and additions on the property. | Land | Improvement |
|---|---|---|---|---|
| 2025 | $5,209 | $369,857 | $131,167 | $238,690 |
| 2024 | $5,209 | $362,606 | $128,596 | $234,010 |
| 2023 | $5,055 | $355,497 | $126,075 | $229,422 |
| 2022 | $5,072 | $348,527 | $123,603 | $224,924 |
| 2021 | $4,983 | $341,694 | $121,180 | $220,514 |
| 2019 | $4,805 | $331,561 | $117,587 | $213,974 |
| 2018 | $4,661 | $325,061 | $115,282 | $209,779 |
| 2016 | $4,389 | $312,440 | $110,806 | $201,634 |
| 2015 | $4,225 | $307,748 | $109,142 | $198,606 |
| 2014 | $4,157 | $301,721 | $107,005 | $194,716 |
Source: Public Records
Map
Nearby Homes
- 27127 Rio Bosque Dr
- 22903 Vista Delgado Dr
- 27021 Rio Bosque Dr
- 22810 Rio Chico Dr
- 22725 Garzota Dr
- 26953 Cuatro Milpas St
- 27240 Trenton Place
- 26927 Cuatro Milpas St
- 27302 Weathersfield Dr
- 26861 Cuatro Milpas St
- 23132 Posada Dr
- 27139 Vista Encantada Dr
- 22949 Sycamore Creek Dr
- 27371 Blueridge Dr
- 22346 Cheraw Dr
- 23141 La Granja Dr
- 26724 Diaz Dr
- 27362 Santa Clarita Rd
- 26721 Diaz Dr
- 23054 La Granja Dr
- 27084 Las Mananitas Dr
- 27092 Las Mananitas Dr
- 27074 Las Mananitas Dr
- 27098 Las Mananitas Dr
- 27085 Las Mananitas Dr
- 27091 Las Mananitas Dr
- 27079 Las Mananitas Dr
- 27116 Vista Delgado Dr
- 27090 Rio Pecos Dr
- 27100 Rio Pecos Dr
- 27104 Rio Pecos Dr
- 27082 Rio Pecos Dr
- 27097 Las Mananitas Dr
- 27108 Rio Pecos Dr
- 27073 Las Mananitas Dr
- 27080 Rio Pecos Dr
- 27062 Las Mananitas Dr
- 27112 Rio Pecos Dr
- 27076 Rio Pecos Dr