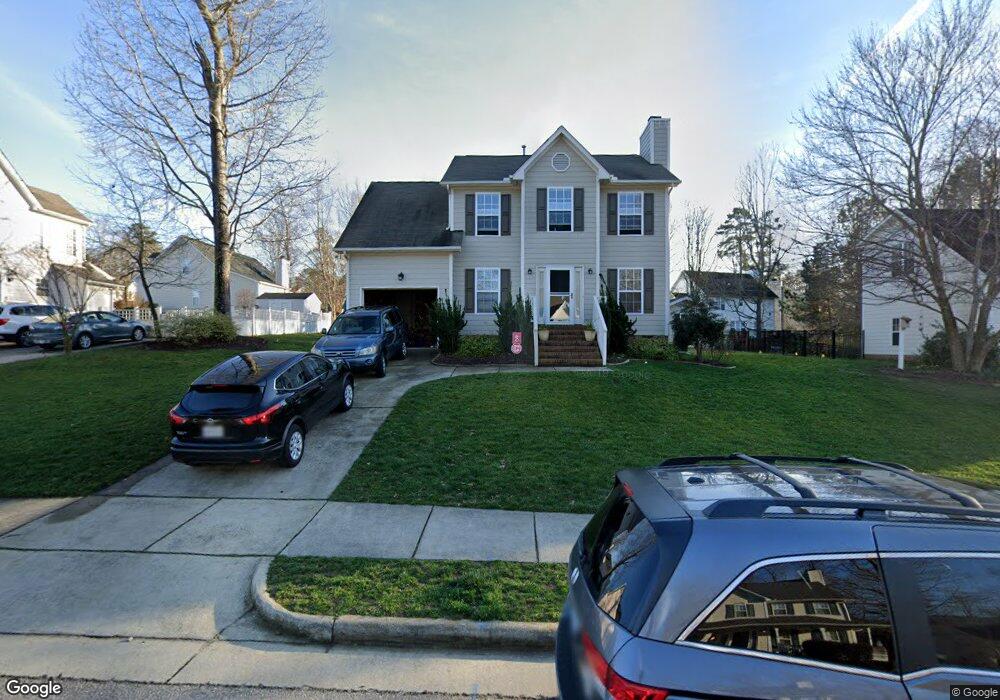
2709 Beehnon Way Raleigh, NC 27603
South Raleigh NeighborhoodEstimated Value: $419,924 - $462,000
3
Beds
3
Baths
1,782
Sq Ft
$251/Sq Ft
Est. Value
About This Home
This home is located at 2709 Beehnon Way, Raleigh, NC 27603 and is currently estimated at $446,981, approximately $250 per square foot. 2709 Beehnon Way is a home located in Wake County with nearby schools including Penny Road Elementary School, Apex Middle, and Apex High School.
Ownership History
Date
Name
Owned For
Owner Type
Purchase Details
Closed on
Jan 15, 2020
Sold by
Smith Daniel G and Smith Amanda M
Bought by
Richey Samuel Frederick and Richey Brooke Scott
Current Estimated Value
Home Financials for this Owner
Home Financials are based on the most recent Mortgage that was taken out on this home.
Original Mortgage
$275,405
Outstanding Balance
$243,331
Interest Rate
3.6%
Mortgage Type
New Conventional
Estimated Equity
$203,650
Purchase Details
Closed on
Dec 14, 2006
Sold by
Pickard Jason A and Pickard Michelle D
Bought by
Smith Daniel G and Smith Amanda M
Home Financials for this Owner
Home Financials are based on the most recent Mortgage that was taken out on this home.
Original Mortgage
$36,000
Interest Rate
8.5%
Mortgage Type
Stand Alone Second
Purchase Details
Closed on
Apr 24, 2000
Sold by
Bill Clark Homes Of Raleigh Llc
Bought by
Pickard Jason A and Pickard Michelle D
Home Financials for this Owner
Home Financials are based on the most recent Mortgage that was taken out on this home.
Original Mortgage
$154,232
Interest Rate
8.25%
Create a Home Valuation Report for This Property
The Home Valuation Report is an in-depth analysis detailing your home's value as well as a comparison with similar homes in the area
Home Values in the Area
Average Home Value in this Area
Purchase History
| Date | Buyer | Sale Price | Title Company |
|---|---|---|---|
| Richey Samuel Frederick | $290,000 | None Available | |
| Smith Daniel G | $180,000 | None Available | |
| Pickard Jason A | $162,500 | -- |
Source: Public Records
Mortgage History
| Date | Status | Borrower | Loan Amount |
|---|---|---|---|
| Open | Richey Samuel Frederick | $275,405 | |
| Previous Owner | Smith Daniel G | $36,000 | |
| Previous Owner | Smith Daniel G | $144,000 | |
| Previous Owner | Pickard Jason A | $154,232 |
Source: Public Records
Tax History Compared to Growth
Tax History
| Year | Tax Paid | Tax Assessment Tax Assessment Total Assessment is a certain percentage of the fair market value that is determined by local assessors to be the total taxable value of land and additions on the property. | Land | Improvement |
|---|---|---|---|---|
| 2025 | $3,400 | $387,556 | $135,000 | $252,556 |
| 2024 | $3,386 | $387,556 | $135,000 | $252,556 |
| 2023 | $2,831 | $257,869 | $65,000 | $192,869 |
| 2022 | $2,631 | $257,869 | $65,000 | $192,869 |
| 2021 | $2,529 | $257,869 | $65,000 | $192,869 |
| 2020 | $2,483 | $257,869 | $65,000 | $192,869 |
| 2019 | $2,411 | $206,279 | $65,000 | $141,279 |
| 2018 | $2,274 | $206,279 | $65,000 | $141,279 |
| 2017 | $2,166 | $206,279 | $65,000 | $141,279 |
| 2016 | $2,122 | $206,279 | $65,000 | $141,279 |
| 2015 | $1,992 | $190,404 | $54,000 | $136,404 |
| 2014 | $1,889 | $190,404 | $54,000 | $136,404 |
Source: Public Records
Map
Nearby Homes
- 2901 Piney Ct
- 1808 Betry Place
- 1709 Evergreen Ave
- 1036 Harper Rd
- 1032 Harper Rd
- 1024 Harper Rd
- 1626 Bruce Cir
- 1008 Harper Rd
- 1020 Harper Rd
- 2028 Lost Ln
- 2837 Tryon Pines Dr
- 1625 Bruce Cir
- 2017 Rabbit Run
- 2801 Henslowe Dr
- 2208 Sierra Dr
- 831 Historian St
- 800 Chapanoke Rd
- 1441 Kirkland Rd
- 1300 Formal Garden Way
- 3113 Henslowe Dr
- 2701 Beehnon Way
- 2905 Sap Ln
- 6201 Beehnon Way
- 2909 Sap Ln
- 2510 Tryon Pines Dr
- 2708 Beehnon Way
- 2704 Beehnon Way
- 2712 Beehnon Way
- 2901 Sap Ln
- 2915 Sap Ln
- 2700 Beehnon Way
- 2716 Beehnon Way
- 2725 Beehnon Way
- 2501 Tryon Pines Dr
- 2505 Tryon Pines Dr
- 2612 Beehnon Way
- 2720 Beehnon Way
- 2914 Sap Ln
- 2904 Sap Ln
- 1800 Clean Ct