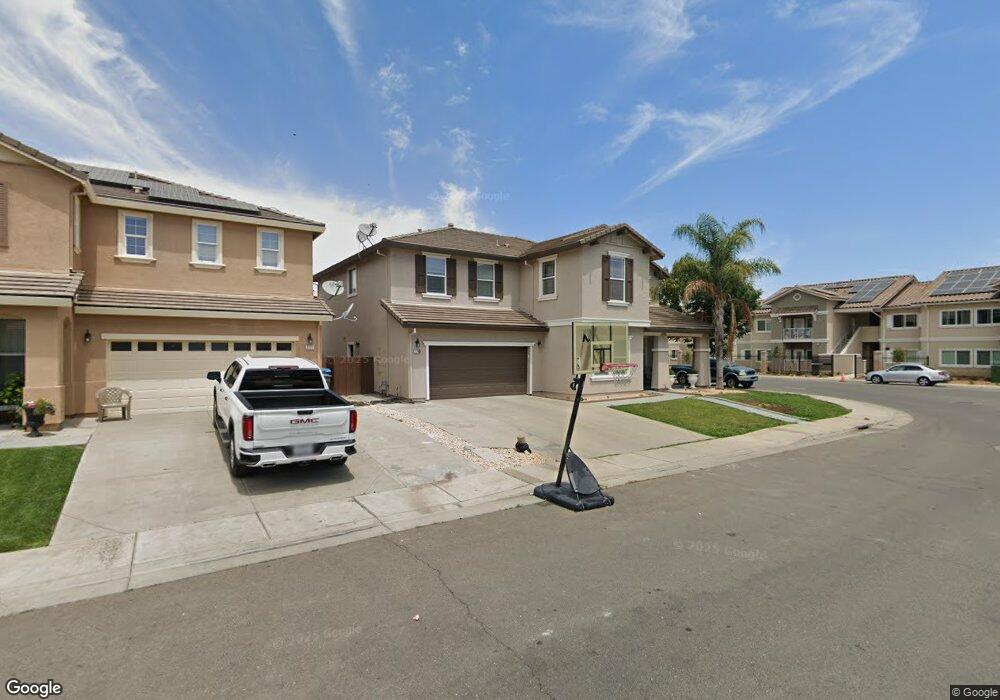
2709 Emily Way Live Oak, CA 95953
Estimated Value: $489,000 - $534,000
5
Beds
4
Baths
3,034
Sq Ft
$169/Sq Ft
Est. Value
About This Home
This home is located at 2709 Emily Way, Live Oak, CA 95953 and is currently estimated at $511,779, approximately $168 per square foot. 2709 Emily Way is a home located in Sutter County.
Ownership History
Date
Name
Owned For
Owner Type
Purchase Details
Closed on
Jun 2, 2025
Sold by
Singh Ranjit
Bought by
Phagura-Uppal Revocable Trust and Phagura
Current Estimated Value
Purchase Details
Closed on
Oct 4, 2013
Sold by
Uppal Parmjit S and Uppal Holly H
Bought by
Singh Ranjit
Purchase Details
Closed on
Sep 27, 2011
Sold by
Singh Surinder and Kaur Kulwinder
Bought by
Uppal Parmjit S and Uppal Holly H
Home Financials for this Owner
Home Financials are based on the most recent Mortgage that was taken out on this home.
Original Mortgage
$144,000
Interest Rate
4.16%
Mortgage Type
New Conventional
Purchase Details
Closed on
May 25, 2006
Sold by
Ryland Homes Of California Inc
Bought by
Singh Surinder and Kaur Kulwinder
Home Financials for this Owner
Home Financials are based on the most recent Mortgage that was taken out on this home.
Original Mortgage
$309,100
Interest Rate
6.46%
Mortgage Type
Fannie Mae Freddie Mac
Create a Home Valuation Report for This Property
The Home Valuation Report is an in-depth analysis detailing your home's value as well as a comparison with similar homes in the area
Purchase History
| Date | Buyer | Sale Price | Title Company |
|---|---|---|---|
| Phagura-Uppal Revocable Trust | -- | None Listed On Document | |
| Singh Ranjit | $223,000 | Chicago Title Company | |
| Uppal Parmjit S | $180,000 | First American Title Company | |
| Singh Surinder | $386,500 | First American Title Co |
Source: Public Records
Mortgage History
| Date | Status | Borrower | Loan Amount |
|---|---|---|---|
| Previous Owner | Uppal Parmjit S | $144,000 | |
| Previous Owner | Singh Surinder | $309,100 |
Source: Public Records
Tax History
| Year | Tax Paid | Tax Assessment Tax Assessment Total Assessment is a certain percentage of the fair market value that is determined by local assessors to be the total taxable value of land and additions on the property. | Land | Improvement |
|---|---|---|---|---|
| 2025 | $4,083 | $273,357 | $42,900 | $230,457 |
| 2024 | $4,083 | $267,998 | $42,059 | $225,939 |
| 2023 | $4,083 | $262,744 | $41,235 | $221,509 |
| 2022 | $3,984 | $257,593 | $40,427 | $217,166 |
| 2021 | $3,045 | $252,548 | $39,638 | $212,910 |
| 2020 | $3,935 | $249,958 | $39,231 | $210,727 |
| 2019 | $3,850 | $245,057 | $38,462 | $206,595 |
| 2018 | $3,812 | $240,252 | $37,708 | $202,544 |
| 2017 | $3,789 | $235,541 | $36,968 | $198,573 |
| 2016 | $3,580 | $230,924 | $36,244 | $194,680 |
| 2015 | $3,557 | $227,455 | $35,699 | $191,756 |
| 2014 | $3,515 | $223,000 | $35,000 | $188,000 |
Source: Public Records
Map
Nearby Homes
Your Personal Tour Guide
Ask me questions while you tour the home.