Estimated Value: $418,000 - $455,000
4
Beds
2
Baths
1,693
Sq Ft
$259/Sq Ft
Est. Value
About This Home
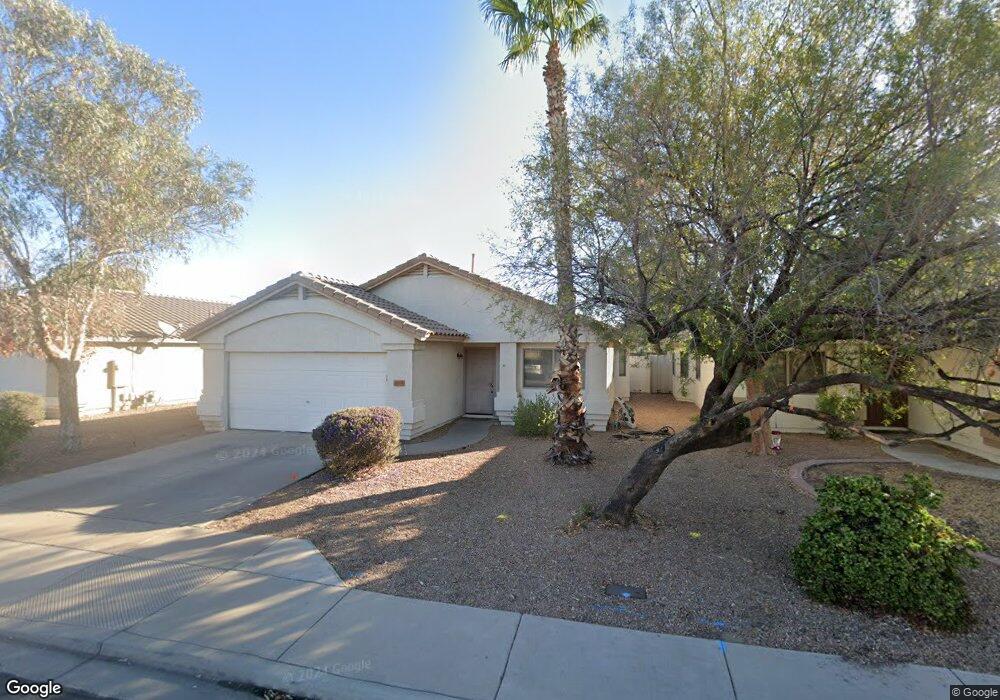
This home is located at 2709 S Keene, Mesa, AZ 85209 and is currently estimated at $438,680, approximately $259 per square foot. 2709 S Keene is a home located in Maricopa County with nearby schools including Augusta Ranch Elementary School, Desert Ridge Jr. High School, and Desert Ridge High School.
Ownership History
Date
Name
Owned For
Owner Type
Purchase Details
Closed on
Dec 22, 2020
Sold by
Imajn Homes Phoenix I Llc
Bought by
Sn Arizona Llc
Current Estimated Value
Purchase Details
Closed on
May 17, 2011
Sold by
Reyes Emmanuel
Bought by
Living Wells Homes Lp
Purchase Details
Closed on
May 26, 2005
Sold by
Hu Linzhi and Lu Qing
Bought by
Reyes Emmanuel
Home Financials for this Owner
Home Financials are based on the most recent Mortgage that was taken out on this home.
Original Mortgage
$207,200
Interest Rate
5.74%
Mortgage Type
New Conventional
Purchase Details
Closed on
May 18, 2004
Sold by
Pawlak Bart and Pawlak Anna
Bought by
Hu Linzhi and Lu Qing
Purchase Details
Closed on
Mar 7, 2000
Sold by
U S Home Corp
Bought by
Pawlak Bart and Pawlak Anna
Home Financials for this Owner
Home Financials are based on the most recent Mortgage that was taken out on this home.
Original Mortgage
$124,693
Interest Rate
8.38%
Mortgage Type
FHA
Create a Home Valuation Report for This Property
The Home Valuation Report is an in-depth analysis detailing your home's value as well as a comparison with similar homes in the area
Home Values in the Area
Average Home Value in this Area
Purchase History
| Date | Buyer | Sale Price | Title Company |
|---|---|---|---|
| Sn Arizona Llc | $28,065,801 | First American Title | |
| Living Wells Homes Lp | $115,000 | Security Title Agency | |
| Reyes Emmanuel | $259,000 | Guaranty Title Agency | |
| Hu Linzhi | $160,000 | Transnation Title | |
| Pawlak Bart | $124,887 | Stewart Title & Trust |
Source: Public Records
Mortgage History
| Date | Status | Borrower | Loan Amount |
|---|---|---|---|
| Previous Owner | Reyes Emmanuel | $207,200 | |
| Previous Owner | Pawlak Bart | $124,693 |
Source: Public Records
Tax History Compared to Growth
Tax History
| Year | Tax Paid | Tax Assessment Tax Assessment Total Assessment is a certain percentage of the fair market value that is determined by local assessors to be the total taxable value of land and additions on the property. | Land | Improvement |
|---|---|---|---|---|
| 2025 | $1,741 | $19,416 | -- | -- |
| 2024 | $1,687 | $18,491 | -- | -- |
| 2023 | $1,687 | $32,130 | $6,420 | $25,710 |
| 2022 | $1,649 | $24,560 | $4,910 | $19,650 |
| 2021 | $1,741 | $23,110 | $4,620 | $18,490 |
| 2020 | $1,713 | $21,180 | $4,230 | $16,950 |
| 2019 | $1,602 | $19,280 | $3,850 | $15,430 |
| 2018 | $1,534 | $17,860 | $3,570 | $14,290 |
| 2017 | $1,489 | $16,560 | $3,310 | $13,250 |
| 2016 | $1,523 | $15,970 | $3,190 | $12,780 |
| 2015 | $1,402 | $15,670 | $3,130 | $12,540 |
Source: Public Records
Map
Nearby Homes
- 9513 E Olla Cir
- 9637 E Olla Ave
- 9434 E Osage Ave
- 2642 S Joplin
- 9721 E Osage Ave Unit 3
- 9328 E Osage Ave
- 9233 E Neville Ave Unit 1011
- 9233 E Neville Ave Unit 1103
- 9316 E Monterey Ave
- 9566 E Plana Ave Unit II
- 9326 E Pampa Ave
- 9744 E Pantera Ave
- 2965 S Sierra Heights Unit 216
- 9302 E Plana Ave
- 9426 E Los Lagos Vista Ave
- 3123 S 99th Cir
- 2821 S Skyline Unit 107
- 2821 S Skyline Unit 176
- 2821 S Skyline Unit 141
- 2821 S Skyline Unit 135