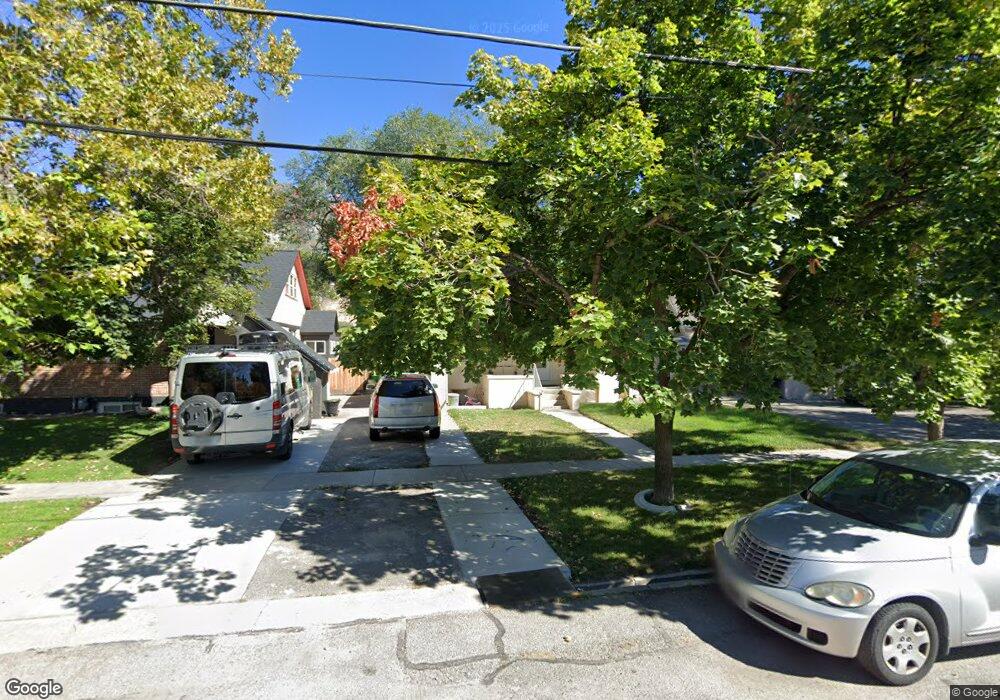
271 S 500 E Provo, UT 84606
Joaquin NeighborhoodEstimated Value: $346,000 - $419,000
2
Beds
1
Bath
728
Sq Ft
$527/Sq Ft
Est. Value
About This Home
This home is located at 271 S 500 E, Provo, UT 84606 and is currently estimated at $383,793, approximately $527 per square foot. 271 S 500 E is a home located in Utah County with nearby schools including Provo Peaks School, Centennial Middle School, and Timpview High School.
Ownership History
Date
Name
Owned For
Owner Type
Purchase Details
Closed on
Mar 20, 2015
Sold by
Miller Farrer D and Miller Mary Lynn
Bought by
Farrer Properties Llc
Current Estimated Value
Purchase Details
Closed on
May 20, 2014
Sold by
Farrer Don Kelly and Miller Mary Lynn
Bought by
Donald Smith And Emma Pauline Farrer Tru
Purchase Details
Closed on
Mar 17, 2014
Sold by
Farrer Don Kelly and Miller Mary Lynn
Bought by
Farrer Properties Llc
Purchase Details
Closed on
Oct 26, 2010
Sold by
Farrer Grant A and Farrer Donald S
Bought by
Farrer Donald S
Purchase Details
Closed on
Mar 2, 2010
Sold by
Rossi Norma F
Bought by
Farrer Grant A and Farrer Donald S
Create a Home Valuation Report for This Property
The Home Valuation Report is an in-depth analysis detailing your home's value as well as a comparison with similar homes in the area
Home Values in the Area
Average Home Value in this Area
Purchase History
| Date | Buyer | Sale Price | Title Company |
|---|---|---|---|
| Farrer Properties Llc | -- | None Available | |
| Donald Smith And Emma Pauline Farrer Tru | -- | None Available | |
| Farrer Properties Llc | -- | None Available | |
| Farrer Donald S | -- | None Available | |
| Farrer Grant A | -- | Fidelity Title |
Source: Public Records
Tax History
| Year | Tax Paid | Tax Assessment Tax Assessment Total Assessment is a certain percentage of the fair market value that is determined by local assessors to be the total taxable value of land and additions on the property. | Land | Improvement |
|---|---|---|---|---|
| 2025 | $1,720 | $189,915 | -- | -- |
| 2024 | $1,720 | $169,290 | $0 | $0 |
| 2023 | $1,707 | $165,660 | $0 | $0 |
| 2022 | $1,885 | $184,415 | $0 | $0 |
| 2021 | $1,364 | $232,700 | $109,600 | $123,100 |
| 2020 | $1,316 | $210,500 | $99,600 | $110,900 |
| 2019 | $1,206 | $200,600 | $99,600 | $101,000 |
| 2018 | $1,074 | $181,200 | $93,400 | $87,800 |
| 2017 | $975 | $90,365 | $0 | $0 |
| 2016 | $886 | $76,560 | $0 | $0 |
| 2015 | $837 | $73,150 | $0 | $0 |
| 2014 | $686 | $62,425 | $0 | $0 |
Source: Public Records
Map
Nearby Homes
Your Personal Tour Guide
Ask me questions while you tour the home.