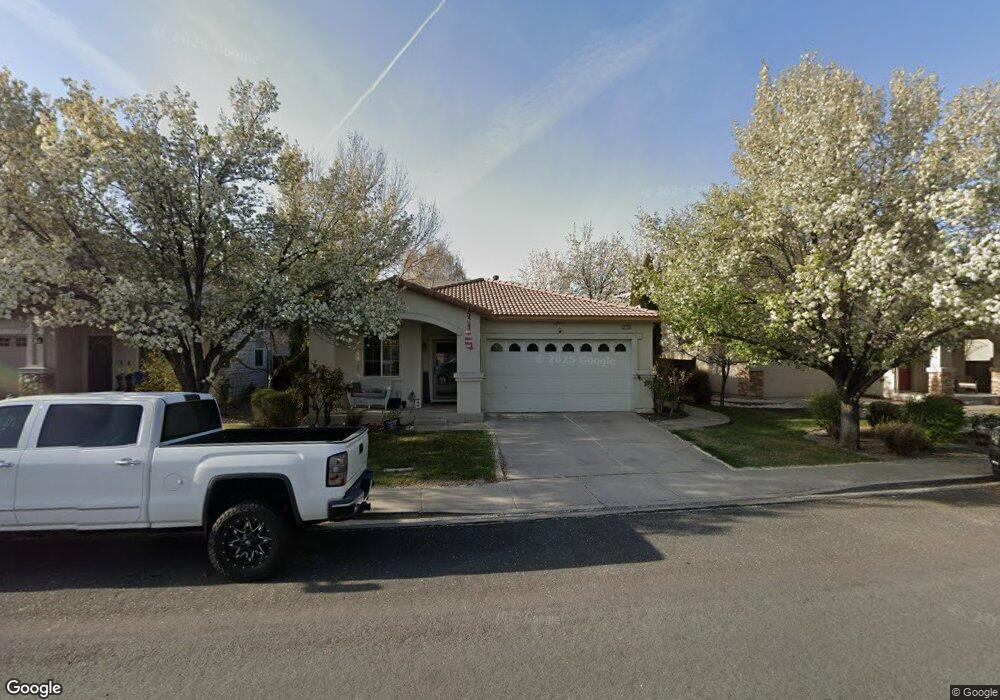
2710 Cintoia Dr Unit 1 Sparks, NV 89434
D'Andrea NeighborhoodEstimated Value: $463,770 - $506,000
2
Beds
2
Baths
1,405
Sq Ft
$348/Sq Ft
Est. Value
About This Home
This home is located at 2710 Cintoia Dr Unit 1, Sparks, NV 89434 and is currently estimated at $489,193, approximately $348 per square foot. 2710 Cintoia Dr Unit 1 is a home located in Washoe County with nearby schools including Marvin Moss Elementary School, Lou Mendive Middle School, and Edward C Reed High School.
Ownership History
Date
Name
Owned For
Owner Type
Purchase Details
Closed on
Sep 9, 2005
Sold by
Ladue Terry M and Ladue Patricia P
Bought by
Ladue Terry M
Current Estimated Value
Home Financials for this Owner
Home Financials are based on the most recent Mortgage that was taken out on this home.
Original Mortgage
$177,500
Interest Rate
5.76%
Mortgage Type
New Conventional
Purchase Details
Closed on
Jun 27, 2002
Sold by
Centex Homes
Bought by
Ladue Terry M and Ladue Patricia P
Home Financials for this Owner
Home Financials are based on the most recent Mortgage that was taken out on this home.
Original Mortgage
$178,100
Interest Rate
6.86%
Create a Home Valuation Report for This Property
The Home Valuation Report is an in-depth analysis detailing your home's value as well as a comparison with similar homes in the area
Home Values in the Area
Average Home Value in this Area
Purchase History
| Date | Buyer | Sale Price | Title Company |
|---|---|---|---|
| Ladue Terry M | -- | Ticor Title Of Nevada Inc | |
| Ladue Terry M | $187,500 | First Centennial Title Co |
Source: Public Records
Mortgage History
| Date | Status | Borrower | Loan Amount |
|---|---|---|---|
| Closed | Ladue Terry M | $177,500 | |
| Closed | Ladue Terry M | $178,100 |
Source: Public Records
Tax History Compared to Growth
Tax History
| Year | Tax Paid | Tax Assessment Tax Assessment Total Assessment is a certain percentage of the fair market value that is determined by local assessors to be the total taxable value of land and additions on the property. | Land | Improvement |
|---|---|---|---|---|
| 2026 | -- | $97,539 | $35,700 | $61,839 |
| 2025 | $2,189 | $95,163 | $32,235 | $62,928 |
| 2024 | $2,189 | $91,174 | $27,685 | $63,489 |
| 2023 | $2,125 | $93,737 | $33,670 | $60,067 |
| 2022 | $2,065 | $78,372 | $28,280 | $50,092 |
| 2021 | $2,005 | $73,814 | $23,940 | $49,874 |
| 2020 | $1,944 | $74,829 | $24,815 | $50,014 |
| 2019 | $1,887 | $70,855 | $22,820 | $48,035 |
| 2018 | $1,832 | $62,964 | $15,890 | $47,074 |
| 2017 | $1,768 | $61,122 | $14,350 | $46,772 |
| 2016 | $1,724 | $62,308 | $14,595 | $47,713 |
| 2015 | $1,724 | $59,544 | $12,005 | $47,539 |
| 2014 | $1,675 | $57,375 | $11,445 | $45,930 |
| 2013 | -- | $44,715 | $8,505 | $36,210 |
Source: Public Records
Map
Nearby Homes
- 2535 Tuscan Way
- 2552 Cosimo Ct
- 2524 Garzoni Dr
- 2159 Meritage Dr
- 1960 Vicenza Dr
- 2600 Anqua Ct
- 2119 Avella Dr
- 1675 Round Mountain Cir
- 1688 Round Mountain Cir
- 3222 Myles Dr
- 2688 Laguna Way
- 3375 Culpepper Dr
- 2616 Michelangelo Ct
- 2634 Michelangelo Ct
- 2874 Garda Ct
- 3253 Clan Alpine Dr
- 3127 Montezuma Way
- 3215 Pantheon Dr
- 1005 Amico Dr
- 2002 Wabash Cir
- 2702 Cintoia Dr
- 2716 Cintoia Dr
- 2695 Bertini Ct
- 2724 Cintoia Dr Unit 1
- 2677 Bertini Ct
- 2713 Cintoia Dr
- 2707 Cintoia Dr Unit 1
- 2730 Cintoia Dr
- 2701 Cintoia Dr Unit 1
- 2770 Panzano Dr
- 2696 Bertini Ct
- 2738 Cintoia Dr Unit 1
- 2659 Venezia Dr
- 2782 Panzano Dr
- 2678 Bertini Ct
- 2115 Panzano Ct
- 2127 Panzano Ct
- 2744 Cintoia Dr
- 2794 Panzano Dr
- 2763 Cintoia Dr