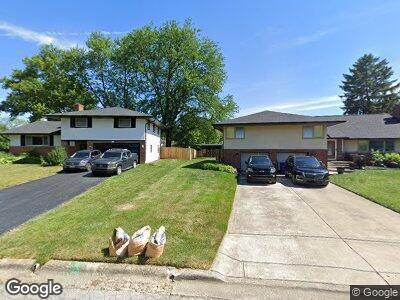
2711 Burnaby Dr Columbus, OH 43209
Berwick NeighborhoodEstimated Value: $319,048 - $351,000
3
Beds
2
Baths
1,209
Sq Ft
$279/Sq Ft
Est. Value
About This Home
This home is located at 2711 Burnaby Dr, Columbus, OH 43209 and is currently estimated at $337,512, approximately $279 per square foot. 2711 Burnaby Dr is a home located in Franklin County with nearby schools including Berwick Alternative K-8 School, Walnut Ridge High School, and Whitehall Preparatory And Fitness Academy.
Ownership History
Date
Name
Owned For
Owner Type
Purchase Details
Closed on
Oct 29, 2004
Sold by
Lofquist Patricia C
Bought by
Grigsby Thomas G and Grigsby Melissa D
Current Estimated Value
Home Financials for this Owner
Home Financials are based on the most recent Mortgage that was taken out on this home.
Original Mortgage
$123,920
Interest Rate
5.95%
Mortgage Type
Unknown
Purchase Details
Closed on
Apr 25, 2000
Sold by
Bogner Stasi B
Bought by
Lofquist Patricia C
Home Financials for this Owner
Home Financials are based on the most recent Mortgage that was taken out on this home.
Original Mortgage
$94,000
Interest Rate
8.24%
Purchase Details
Closed on
Apr 23, 1998
Sold by
Kuhn Neptunus R and Kuhn William Lee
Bought by
Bogner Stasi B
Purchase Details
Closed on
Jul 30, 1990
Create a Home Valuation Report for This Property
The Home Valuation Report is an in-depth analysis detailing your home's value as well as a comparison with similar homes in the area
Home Values in the Area
Average Home Value in this Area
Purchase History
| Date | Buyer | Sale Price | Title Company |
|---|---|---|---|
| Grigsby Thomas G | $154,900 | Title First | |
| Lofquist Patricia C | $127,900 | Midland Celtic Title | |
| Bogner Stasi B | $116,000 | Chicago Title | |
| -- | $88,400 | -- |
Source: Public Records
Mortgage History
| Date | Status | Borrower | Loan Amount |
|---|---|---|---|
| Open | Grigsby Thomas G | $156,633 | |
| Closed | Grigsby Thomas G | $123,920 | |
| Closed | Grigsby Thomas G | $30,980 | |
| Closed | Lofquist Patricia C | $27,700 | |
| Closed | Lofquist Scott E | $94,000 | |
| Closed | Lofquist Patricia C | $94,000 |
Source: Public Records
Tax History Compared to Growth
Tax History
| Year | Tax Paid | Tax Assessment Tax Assessment Total Assessment is a certain percentage of the fair market value that is determined by local assessors to be the total taxable value of land and additions on the property. | Land | Improvement |
|---|---|---|---|---|
| 2024 | $5,090 | $90,130 | $29,440 | $60,690 |
| 2023 | $4,410 | $90,125 | $29,435 | $60,690 |
| 2022 | $3,826 | $62,620 | $12,990 | $49,630 |
| 2021 | $3,823 | $62,620 | $12,990 | $49,630 |
| 2020 | $3,812 | $62,620 | $12,990 | $49,630 |
| 2019 | $3,576 | $50,160 | $10,400 | $39,760 |
| 2018 | $3,474 | $50,160 | $10,400 | $39,760 |
| 2017 | $3,587 | $50,160 | $10,400 | $39,760 |
| 2016 | $3,614 | $47,150 | $11,480 | $35,670 |
| 2015 | $3,387 | $47,150 | $11,480 | $35,670 |
| 2014 | $3,393 | $47,150 | $11,480 | $35,670 |
| 2013 | $1,699 | $46,585 | $10,920 | $35,665 |
Source: Public Records
Map
Nearby Homes
- 2639 Halleck Dr
- 2627 Halleck Dr
- 2715 Kenview Rd S
- 1677 Kenview Rd
- 2826 Proctor Dr
- 1782 Newfield Rd
- 2894 Langfield Dr
- 1585 Peace Place
- 2894 Landon Dr
- 1482 Cottingham Ct W
- 2957 Ivanhoe Dr
- 2747 Castlewood Rd
- 1727 Niagara Rd
- 1428 Haddon Rd
- 2628 Berwick Blvd
- 2430 Briers Dr Unit B
- 2940 Belmar Rd
- 1626 Zettler Rd
- 2424 Ravenel Dr
- 3084 Clermont Rd
- 2711 Burnaby Dr
- 2719 Burnaby Dr
- 2685 Burnaby Dr
- 2685 Burnaby Dr
- 2697 Burnaby Dr
- 2697 Burnaby Dr
- 2691 Burnaby Dr
- 2673 Burnaby Dr
- 2673 Burnaby Dr
- 2690 Burnaby Dr
- 2705 Burnaby Dr
- 2705 Burnaby Dr
- 2702 Burnaby Dr
- 2678 Burnaby Dr
- 2679 Burnaby Dr
- 2686 Halleck Dr
- 2661 Burnaby Dr
- 2670 Halleck Dr
- 2696 Halleck Dr
- 2714 Burnaby Dr