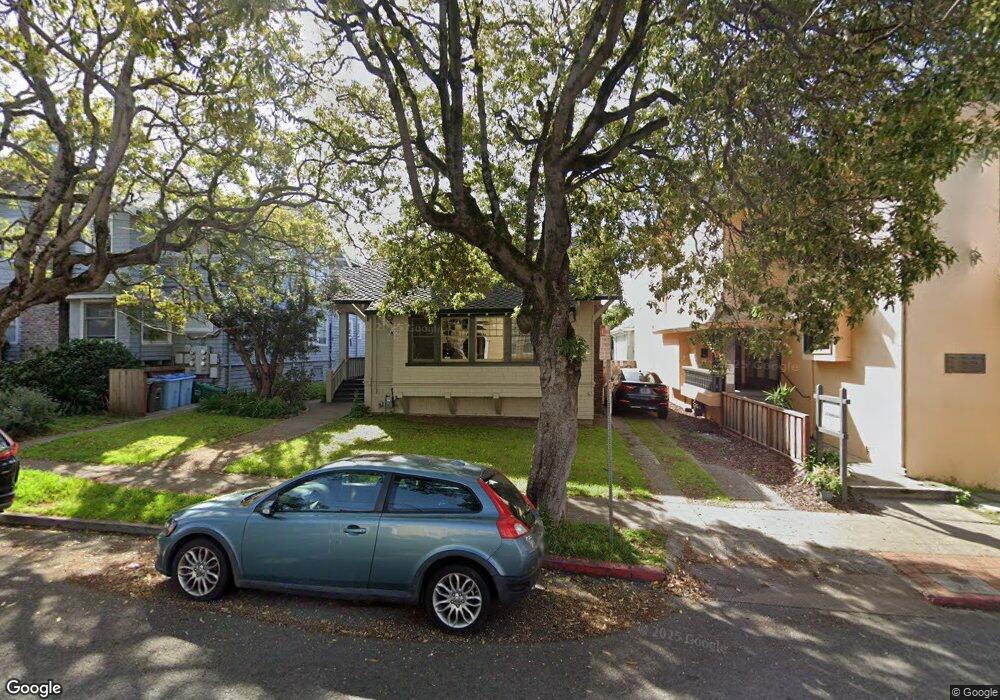
2712 Alcatraz Ave Berkeley, CA 94705
Elmwood NeighborhoodEstimated Value: $1,795,697 - $2,432,000
3
Beds
2
Baths
1,982
Sq Ft
$1,126/Sq Ft
Est. Value
About This Home
This home is located at 2712 Alcatraz Ave, Berkeley, CA 94705 and is currently estimated at $2,231,924, approximately $1,126 per square foot. 2712 Alcatraz Ave is a home located in Alameda County with nearby schools including John Muir Elementary School, Emerson Elementary School, and Malcolm X Elementary School.
Ownership History
Date
Name
Owned For
Owner Type
Purchase Details
Closed on
Apr 25, 2017
Sold by
Defigueiredo David M
Bought by
Defigueiredo David M and David M De Figueiredo Living T
Current Estimated Value
Purchase Details
Closed on
Mar 28, 2006
Sold by
Ravenscroft John A
Bought by
Ravenscroft John A and John A Ravenscroft Living Trus
Purchase Details
Closed on
Nov 24, 1993
Sold by
Ravenscroft John A and Ravenscroft John
Bought by
Ravenscroft John A and Defigueiredo David M
Home Financials for this Owner
Home Financials are based on the most recent Mortgage that was taken out on this home.
Original Mortgage
$145,000
Interest Rate
6.74%
Create a Home Valuation Report for This Property
The Home Valuation Report is an in-depth analysis detailing your home's value as well as a comparison with similar homes in the area
Home Values in the Area
Average Home Value in this Area
Purchase History
| Date | Buyer | Sale Price | Title Company |
|---|---|---|---|
| Defigueiredo David M | -- | None Available | |
| Defigueiredo David M | -- | None Available | |
| Ravenscroft John A | -- | None Available | |
| Defigueiredo David M | -- | None Available | |
| Ravenscroft John A | $72,500 | -- |
Source: Public Records
Mortgage History
| Date | Status | Borrower | Loan Amount |
|---|---|---|---|
| Previous Owner | Ravenscroft John A | $145,000 |
Source: Public Records
Tax History
| Year | Tax Paid | Tax Assessment Tax Assessment Total Assessment is a certain percentage of the fair market value that is determined by local assessors to be the total taxable value of land and additions on the property. | Land | Improvement |
|---|---|---|---|---|
| 2025 | $8,291 | $228,387 | $194,972 | $40,415 |
| 2024 | $8,291 | $223,772 | $191,149 | $39,623 |
| 2023 | $8,014 | $226,248 | $187,402 | $38,846 |
| 2022 | $7,705 | $214,811 | $183,727 | $38,084 |
| 2021 | $7,656 | $210,463 | $180,125 | $37,338 |
| 2020 | $7,014 | $215,233 | $178,278 | $36,955 |
| 2019 | $6,477 | $211,013 | $174,783 | $36,230 |
| 2018 | $6,295 | $206,876 | $171,356 | $35,520 |
| 2017 | $6,052 | $202,821 | $167,997 | $34,824 |
| 2016 | $5,669 | $198,845 | $164,704 | $34,141 |
| 2015 | $5,556 | $195,858 | $162,230 | $33,628 |
| 2014 | $5,384 | $192,023 | $159,053 | $32,970 |
Source: Public Records
Map
Nearby Homes
- 360 Alcatraz Ave
- 6100 Chabot Rd
- 6446 Colby St
- 2477 Prince St
- 2962 Piedmont Ave
- 5941 Keith Ave
- 2935 Florence St
- 5936 Broadway
- 6189 Margarido Dr
- 6445 Irwin Ct
- 2917 Telegraph Ave
- 556 Alcatraz Ave
- 5466 Shafter Ave
- 5499 Claremont Ave
- 3046 Deakin St
- 2643 Stuart St
- 204 El Camino Real
- 2243 Ashby Ave
- 2817 Palm Ct
- 629 66th St
- 2716 Alcatraz Ave
- 3205 College Ave
- 3217 College Ave
- 2720 Alcatraz Ave
- 3185 College Ave
- 2717 Alcatraz Ave
- 2724 Alcatraz Ave
- 3160 Lewiston Ave
- 3188 College Ave
- 3167 College Ave
- 3214 College Ave
- 3306 Claremont Ave
- 3304 Claremont Ave
- 3154 Lewiston Ave
- 2636 Alcatraz Ave
- 2727 Alcatraz Ave
- 3302 Claremont Ave
- 3152 Lewiston Ave
- 3151 College Ave
- 2607 Alcatraz Ave
Your Personal Tour Guide
Ask me questions while you tour the home.