2712 Oak Rd Unit 61 Walnut Creek, CA 94597
Contra Costa Centre NeighborhoodEstimated Value: $504,000 - $592,000
3
Beds
2
Baths
1,181
Sq Ft
$451/Sq Ft
Est. Value
About This Home
This home is located at 2712 Oak Rd Unit 61, Walnut Creek, CA 94597 and is currently estimated at $532,091, approximately $450 per square foot. 2712 Oak Rd Unit 61 is a home located in Contra Costa County with nearby schools including Indian Valley Elementary School, Walnut Creek Intermediate School, and Las Lomas High School.
Ownership History
Date
Name
Owned For
Owner Type
Purchase Details
Closed on
Jun 10, 2013
Sold by
Shoka Max Luhende and Shoka Estrella Hernandez
Bought by
Gong Shuang and Wong Martin R
Current Estimated Value
Home Financials for this Owner
Home Financials are based on the most recent Mortgage that was taken out on this home.
Original Mortgage
$256,200
Outstanding Balance
$182,165
Interest Rate
3.48%
Mortgage Type
New Conventional
Estimated Equity
$349,926
Purchase Details
Closed on
Jun 2, 2008
Sold by
Shoka Max Luhende and Shoka Estrella Hernandez
Bought by
Shoka Max Luhende and Shoka Estrella Hernandez
Purchase Details
Closed on
Jul 8, 2004
Sold by
Waxman Jacob I
Bought by
Shoka Max Luhende and Shoka Estrella Hernandez
Home Financials for this Owner
Home Financials are based on the most recent Mortgage that was taken out on this home.
Original Mortgage
$292,400
Interest Rate
5.87%
Mortgage Type
Purchase Money Mortgage
Create a Home Valuation Report for This Property
The Home Valuation Report is an in-depth analysis detailing your home's value as well as a comparison with similar homes in the area
Home Values in the Area
Average Home Value in this Area
Purchase History
| Date | Buyer | Sale Price | Title Company |
|---|---|---|---|
| Gong Shuang | $366,000 | Old Republic Title Company | |
| Shoka Max Luhende | -- | None Available | |
| Shoka Max Luhende | $365,500 | Chicago Title |
Source: Public Records
Mortgage History
| Date | Status | Borrower | Loan Amount |
|---|---|---|---|
| Open | Gong Shuang | $256,200 | |
| Previous Owner | Shoka Max Luhende | $292,400 |
Source: Public Records
Tax History Compared to Growth
Tax History
| Year | Tax Paid | Tax Assessment Tax Assessment Total Assessment is a certain percentage of the fair market value that is determined by local assessors to be the total taxable value of land and additions on the property. | Land | Improvement |
|---|---|---|---|---|
| 2025 | $5,881 | $450,691 | $283,222 | $167,469 |
| 2024 | $5,741 | $441,855 | $277,669 | $164,186 |
| 2023 | $5,741 | $433,192 | $272,225 | $160,967 |
| 2022 | $5,662 | $424,699 | $266,888 | $157,811 |
| 2021 | $5,509 | $416,372 | $261,655 | $154,717 |
| 2019 | $5,375 | $404,025 | $253,896 | $150,129 |
| 2018 | $5,208 | $396,104 | $248,918 | $147,186 |
| 2017 | $5,102 | $388,338 | $244,038 | $144,300 |
| 2016 | $4,995 | $380,724 | $239,253 | $141,471 |
| 2015 | $4,882 | $375,006 | $235,660 | $139,346 |
| 2014 | $4,821 | $367,661 | $231,044 | $136,617 |
Source: Public Records
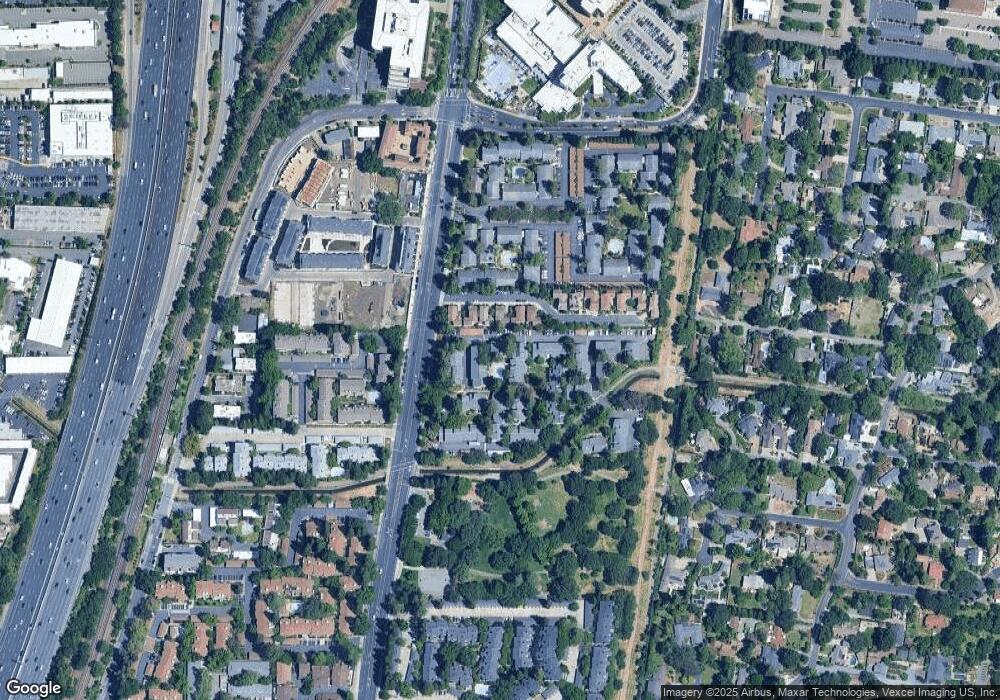
Map
Nearby Homes
- 2712 Oak Rd Unit 60
- 2712 Oak Rd Unit 57
- 2708 Oak Rd Unit 9
- 2709 Oak Rd Unit H
- 2716 Oak Rd Unit 111
- 2716 Oak Rd Unit 117
- 2704 Oak Rd Unit 80
- 2704 Oak Rd Unit 77
- 2724 Oak Rd Unit 88
- 178 Oak Cir
- Plan 5X at Oak Grove
- Plan 6 at Oak Grove
- Plan 3 at Oak Grove
- Plan 4X at Oak Grove
- Plan 5 at Oak Grove
- Plan 6X at Oak Grove
- 2735 Oak Rd
- 225 Oak Cir
- 231 Oak Cir
- 186 Oak Cir
- 2712 Oak Rd Unit 63
- 2712 Oak Rd Unit 62
- 2712 Oak Rd Unit 59
- 2712 Oak Rd Unit 58
- 2712 Oak Rd Unit 56
- 2712 Oak Rd Unit 55
- 2712 Oak Rd Unit 54
- 2712 Oak Rd Unit 53
- 2712 Oak Rd Unit 52
- 2712 Oak Rd Unit 51
- 2712 Oak Rd Unit 50
- 2712 Oak Rd Unit 67
- 2712 Oak Rd Unit 66
- 2712 Oak Rd Unit 65
- 2712 Oak Rd Unit 64
- 314 Parnell Ct Unit 316
- 310 Parnell Ct Unit 312
- 318 Parnell Ct Unit 320
- 306 Parnell Ct Unit 308
- 324 Parnell Ct