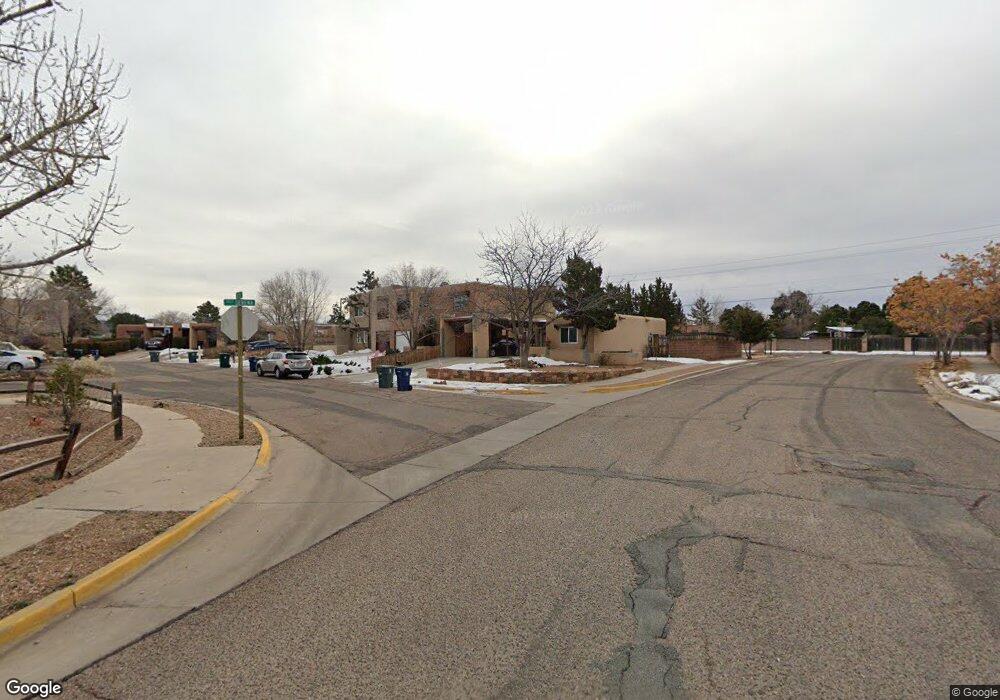
2712 Rincon Ct Santa Fe, NM 87505
Estimated Value: $345,000 - $408,000
2
Beds
2
Baths
1,009
Sq Ft
$377/Sq Ft
Est. Value
About This Home
This home is located at 2712 Rincon Ct, Santa Fe, NM 87505 and is currently estimated at $380,487, approximately $377 per square foot. 2712 Rincon Ct is a home located in Santa Fe County with nearby schools including Chaparral Elementary School, Santa Fe High School, and Little Earth School.
Ownership History
Date
Name
Owned For
Owner Type
Purchase Details
Closed on
Jun 30, 2020
Sold by
Kayanaugh Loraine S
Bought by
Parada Juan Carlos Sosa and Parada Alberto Sosa
Current Estimated Value
Home Financials for this Owner
Home Financials are based on the most recent Mortgage that was taken out on this home.
Original Mortgage
$188,000
Outstanding Balance
$167,015
Interest Rate
3.2%
Mortgage Type
New Conventional
Estimated Equity
$213,472
Purchase Details
Closed on
Mar 5, 2014
Sold by
Padilla Leonard G
Bought by
Kavanaugh Nick C and Kavanaugh Lorraine S
Home Financials for this Owner
Home Financials are based on the most recent Mortgage that was taken out on this home.
Original Mortgage
$123,250
Interest Rate
4.44%
Mortgage Type
New Conventional
Create a Home Valuation Report for This Property
The Home Valuation Report is an in-depth analysis detailing your home's value as well as a comparison with similar homes in the area
Home Values in the Area
Average Home Value in this Area
Purchase History
| Date | Buyer | Sale Price | Title Company |
|---|---|---|---|
| Parada Juan Carlos Sosa | -- | Fidelity National Ttl Ins Co | |
| Kavanaugh Nick C | -- | Fidelity Natl Title Of New M |
Source: Public Records
Mortgage History
| Date | Status | Borrower | Loan Amount |
|---|---|---|---|
| Open | Parada Juan Carlos Sosa | $188,000 | |
| Previous Owner | Kavanaugh Nick C | $123,250 | |
| Previous Owner | Kavanaugh Nick C | $14,500 |
Source: Public Records
Tax History Compared to Growth
Tax History
| Year | Tax Paid | Tax Assessment Tax Assessment Total Assessment is a certain percentage of the fair market value that is determined by local assessors to be the total taxable value of land and additions on the property. | Land | Improvement |
|---|---|---|---|---|
| 2024 | $1,875 | $246,056 | $77,250 | $168,806 |
| 2023 | $1,875 | $238,890 | $75,000 | $163,890 |
| 2022 | $1,834 | $231,933 | $75,000 | $156,933 |
| 2021 | $1,805 | $75,059 | $24,999 | $50,060 |
| 2020 | $1,233 | $51,293 | $17,681 | $33,612 |
| 2019 | $1,167 | $49,799 | $17,166 | $32,633 |
| 2018 | $1,139 | $48,349 | $16,666 | $31,683 |
| 2017 | $1,109 | $46,941 | $16,666 | $30,275 |
| 2016 | $1,045 | $45,574 | $16,667 | $28,907 |
| 2015 | $1,019 | $44,247 | $16,667 | $27,580 |
| 2014 | $868 | $43,093 | $16,650 | $26,443 |
Source: Public Records
Map
Nearby Homes
- 2591 Calle Delfino
- 2813 Plaza Amarilla
- 2803 Plaza Amarilla
- 2844 Plaza Amarilla
- 2918 Pasaje Del Herrero
- 2317 Calle Pacifica
- 2963 Camino Piedra Lumbre
- 2551 Camino Cabestro
- 2600 W Zia Rd Unit I-5
- 2600 W Zia Rd Unit C6
- 2305 Calle Pacifica
- 2779 Via Caballero Del Sur
- 2914 Corte Del Pozo
- 2712 Sol Y Luz Loop
- 2730 Calle Anna Jean Unit D
- 2816 Plaza Verde
- 2996 Plaza Blanca
- 2980 Plaza Azul
- 2215 Rancho Siringo Rd Unit 6
- 2926 Calle Del Res
- 2710 Rincon Ct
- 2708 Rincon Ct
- 2700 Calle Serena
- 2706 Rincon Ct
- 2702 Calle Serena
- 2709 Calle Serena
- 2704 Rincon Ct
- 2704 Calle Serena
- 2711 Calle Serena
- 2500 Camino Alfredo
- 2706 Calle Serena
- 2711 Rincon Ct
- 2709 Rincon Ct
- 2708 Calle Serena
- 2702 Rincon Ct
- 2501 Calle Melecio
- 2700 Rincon Ct
- 2707 Rincon Ct
- 2710 Calle Serena
- 2701 Rincon Ct