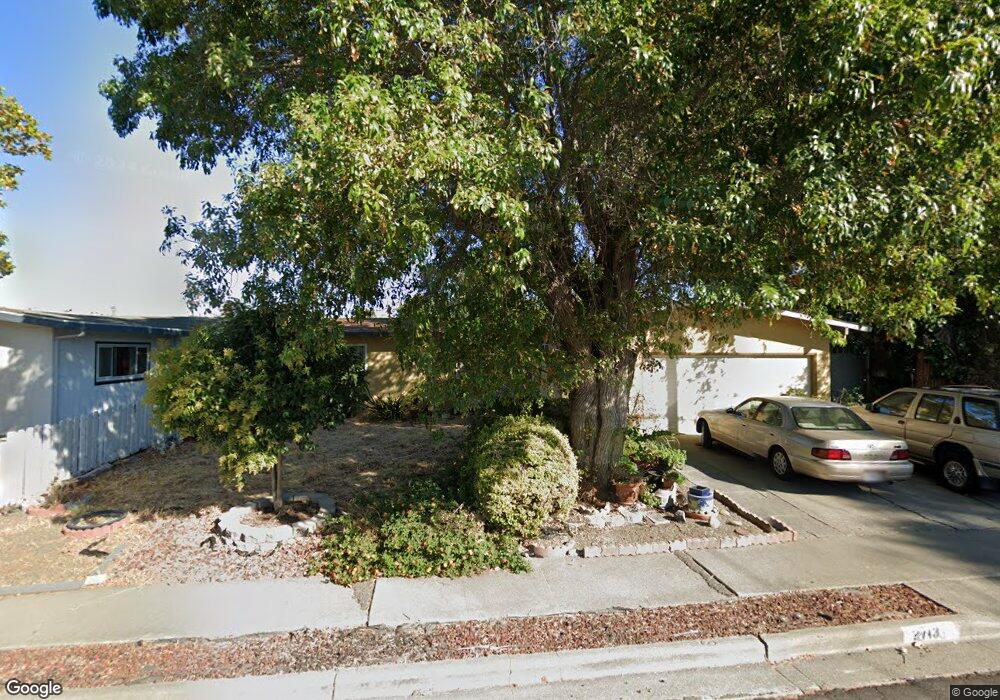
2713 Argyll Ave Concord, CA 94520
Buchanan Field NeighborhoodEstimated Value: $610,000 - $655,000
3
Beds
1
Bath
1,215
Sq Ft
$517/Sq Ft
Est. Value
About This Home
This home is located at 2713 Argyll Ave, Concord, CA 94520 and is currently estimated at $627,617, approximately $516 per square foot. 2713 Argyll Ave is a home located in Contra Costa County with nearby schools including Holbrook Language Academy, Valley View Middle School, and Mt. Diablo High School.
Ownership History
Date
Name
Owned For
Owner Type
Purchase Details
Closed on
Jun 2, 1999
Sold by
Bonham Steven L and Bonham Elizabeth
Bought by
Ramirez Maria Delrosario
Current Estimated Value
Home Financials for this Owner
Home Financials are based on the most recent Mortgage that was taken out on this home.
Original Mortgage
$128,000
Outstanding Balance
$33,341
Interest Rate
6.9%
Mortgage Type
Stand Alone First
Estimated Equity
$594,276
Purchase Details
Closed on
Mar 18, 1999
Sold by
Bonham Steven L and Bonham Elizabeth A
Bought by
Bonham Steven L and Bonham Elizabeth A
Purchase Details
Closed on
Feb 20, 1996
Sold by
Bonham Steven L and Bonham Elizabeth A
Bought by
Bonham Steven L and Bonham Elizabeth A
Home Financials for this Owner
Home Financials are based on the most recent Mortgage that was taken out on this home.
Original Mortgage
$135,000
Interest Rate
7.04%
Mortgage Type
Purchase Money Mortgage
Purchase Details
Closed on
May 24, 1994
Sold by
Bonham Steven L and Bonham Elizabeth A
Bought by
Bonham Steven L and Bonham Elizabeth A
Create a Home Valuation Report for This Property
The Home Valuation Report is an in-depth analysis detailing your home's value as well as a comparison with similar homes in the area
Home Values in the Area
Average Home Value in this Area
Purchase History
| Date | Buyer | Sale Price | Title Company |
|---|---|---|---|
| Ramirez Maria Delrosario | $160,000 | Commonwealth Land Title Co | |
| Bonham Steven L | -- | -- | |
| Bonham Steven L | -- | North American Title Co | |
| Bonham Steven L | -- | -- |
Source: Public Records
Mortgage History
| Date | Status | Borrower | Loan Amount |
|---|---|---|---|
| Open | Ramirez Maria Delrosario | $128,000 | |
| Previous Owner | Bonham Steven L | $135,000 |
Source: Public Records
Tax History
| Year | Tax Paid | Tax Assessment Tax Assessment Total Assessment is a certain percentage of the fair market value that is determined by local assessors to be the total taxable value of land and additions on the property. | Land | Improvement |
|---|---|---|---|---|
| 2025 | $7,939 | $250,808 | $117,565 | $133,243 |
| 2024 | $7,743 | $245,891 | $115,260 | $130,631 |
| 2023 | $7,743 | $241,070 | $113,000 | $128,070 |
| 2022 | $7,676 | $236,344 | $110,785 | $125,559 |
| 2021 | $7,576 | $231,711 | $108,613 | $123,098 |
| 2019 | $7,475 | $224,841 | $105,393 | $119,448 |
| 2018 | $7,341 | $220,433 | $103,327 | $117,106 |
| 2017 | $7,225 | $216,111 | $101,301 | $114,810 |
| 2016 | $2,905 | $211,874 | $99,315 | $112,559 |
| 2015 | $2,846 | $208,693 | $97,824 | $110,869 |
| 2014 | $2,773 | $204,606 | $95,908 | $108,698 |
Source: Public Records
Map
Nearby Homes
- 2719 Edward Ave
- 2831 Richard Ave
- 2766 Argyll Ave
- 2780 Argyll Ave
- 2102 Overhill Rd
- 2816 Glenside Dr
- 1925 Solano Way
- 2917 Knoll Dr
- 2719 Grant St
- 2868 Avon Ave
- 1838 Overhill Rd
- 2219 Acacia Dr
- 2829 Hilltop Rd
- 2653 Garden Ave
- 3013 Justin Way
- 3185 Claudia Dr
- 1975 Bonifacio St Unit 5
- 1971 Bonifacio St Unit 3
- 2067 Olivera Rd Unit B
- 2069 Olivera Rd Unit E
- 2707 Argyll Ave
- 2719 Argyll Ave
- 2712 Kay Ave
- 2706 Kay Ave Unit 1
- 2718 Kay Ave
- 2701 Argyll Ave
- 2712 Argyll Ave
- 2725 Argyll Ave
- 2718 Argyll Ave
- 2706 Argyll Ave
- 2806 Richard Ave
- 2724 Kay Ave
- 2724 Argyll Ave
- 2700 Argyll Ave
- 2731 Argyll Ave
- 2730 Kay Ave
- 2713 Edward Ave
- 2713 Kay Ave
- 2707 Kay Ave
- 2719 Kay Ave
Your Personal Tour Guide
Ask me questions while you tour the home.