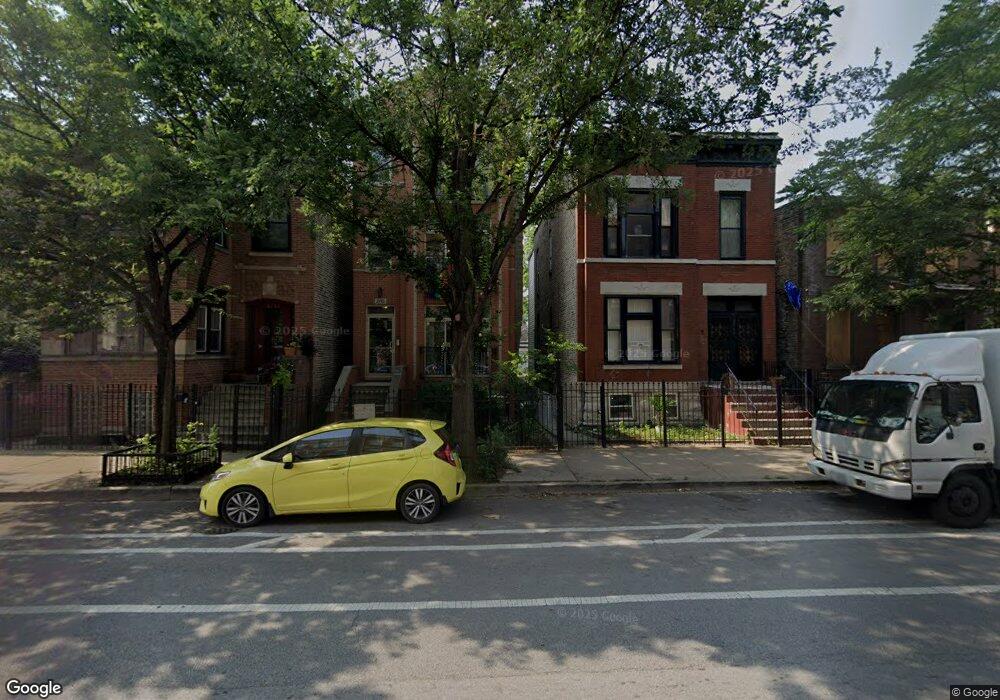
2713 W Augusta Blvd Unit 3 Chicago, IL 60622
Humboldt Park NeighborhoodEstimated Value: $391,000 - $460,000
2
Beds
2
Baths
1,375
Sq Ft
$309/Sq Ft
Est. Value
About This Home
This home is located at 2713 W Augusta Blvd Unit 3, Chicago, IL 60622 and is currently estimated at $425,524, approximately $309 per square foot. 2713 W Augusta Blvd Unit 3 is a home located in Cook County with nearby schools including Chopin Elementary School, Clemente Community Academy High School, and Acero - Esmera Santiago Elementary School.
Ownership History
Date
Name
Owned For
Owner Type
Purchase Details
Closed on
Feb 5, 2009
Sold by
Halim Kamarul and Starks Sarah
Bought by
Rhee Jane Jayoung
Current Estimated Value
Purchase Details
Closed on
Apr 19, 2007
Sold by
Halim Kamarul and Stark Sarah
Bought by
Halim Kamarul and Starks Sarah
Home Financials for this Owner
Home Financials are based on the most recent Mortgage that was taken out on this home.
Original Mortgage
$260,000
Interest Rate
5.87%
Mortgage Type
Construction
Purchase Details
Closed on
May 23, 2005
Sold by
Agusta Condo Inc
Bought by
Halim Kamarul
Home Financials for this Owner
Home Financials are based on the most recent Mortgage that was taken out on this home.
Original Mortgage
$265,500
Interest Rate
6.3%
Mortgage Type
Fannie Mae Freddie Mac
Create a Home Valuation Report for This Property
The Home Valuation Report is an in-depth analysis detailing your home's value as well as a comparison with similar homes in the area
Home Values in the Area
Average Home Value in this Area
Purchase History
| Date | Buyer | Sale Price | Title Company |
|---|---|---|---|
| Rhee Jane Jayoung | $255,000 | Chicago Title Insurance Co | |
| Halim Kamarul | -- | Ct | |
| Halim Kamarul | -- | Ct | |
| Halim Kamarul | $295,000 | -- |
Source: Public Records
Mortgage History
| Date | Status | Borrower | Loan Amount |
|---|---|---|---|
| Previous Owner | Halim Kamarul | $260,000 | |
| Previous Owner | Halim Kamarul | $265,500 |
Source: Public Records
Tax History Compared to Growth
Tax History
| Year | Tax Paid | Tax Assessment Tax Assessment Total Assessment is a certain percentage of the fair market value that is determined by local assessors to be the total taxable value of land and additions on the property. | Land | Improvement |
|---|---|---|---|---|
| 2024 | $5,335 | $34,750 | $4,239 | $30,511 |
| 2023 | $5,163 | $28,524 | $1,930 | $26,594 |
| 2022 | $5,163 | $28,524 | $1,930 | $26,594 |
| 2021 | $5,066 | $28,523 | $1,930 | $26,593 |
| 2020 | $4,101 | $21,511 | $1,930 | $19,581 |
| 2019 | $4,091 | $23,790 | $1,930 | $21,860 |
| 2018 | $4,021 | $23,790 | $1,930 | $21,860 |
| 2017 | $3,934 | $21,650 | $1,703 | $19,947 |
| 2016 | $3,836 | $21,650 | $1,703 | $19,947 |
| 2015 | $3,487 | $21,650 | $1,703 | $19,947 |
| 2014 | $3,242 | $20,043 | $1,532 | $18,511 |
| 2013 | $3,167 | $20,043 | $1,532 | $18,511 |
Source: Public Records
Map
Nearby Homes
- 938 N Washtenaw Ave
- 941 N Fairfield Ave Unit 1
- 929 N Fairfield Ave
- 2651 W Augusta Blvd Unit 1
- 2651 W Augusta Blvd Unit 3
- 936 N Fairfield Ave
- 942 N Fairfield Ave Unit 2W
- 2647 W Cortez St
- 841 N Fairfield Ave
- 938 N California Ave Unit 2
- 948 N California Ave
- 2714 W Cortez St Unit 1
- 851 N California Ave Unit 4
- 845 N California Ave Unit 2
- 827 N Fairfield Ave
- 2624 W Rice St Unit 2F
- 833 N California Ave Unit 1C
- 2708 W Thomas St Unit 2
- 1046 N Rockwell St
- 824 N California Ave
- 2713 W Augusta Blvd Unit 2
- 2713 W Augusta Blvd Unit 1
- 2711 W Augusta Blvd
- 2715 W Augusta Blvd
- 2709 W Augusta Blvd
- 2707 W Augusta Blvd Unit 3
- 2707 W Augusta Blvd Unit 1A
- 2707 W Augusta Blvd
- 2707 W Augusta Blvd Unit 2
- 2705 W Augusta Blvd
- 2725 W Augusta Blvd
- 948 N Washtenaw Ave Unit 3S
- 948 N Washtenaw Ave Unit 1N
- 948 N Washtenaw Ave Unit 3N
- 948 N Washtenaw Ave Unit 2S
- 948 N Washtenaw Ave Unit 1S
- 948 N Washtenaw Ave Unit 2N
- 948 N Washtenaw Ave Unit 3M
- 2701 W Augusta Blvd Unit 2
- 2701 W Augusta Blvd Unit 3