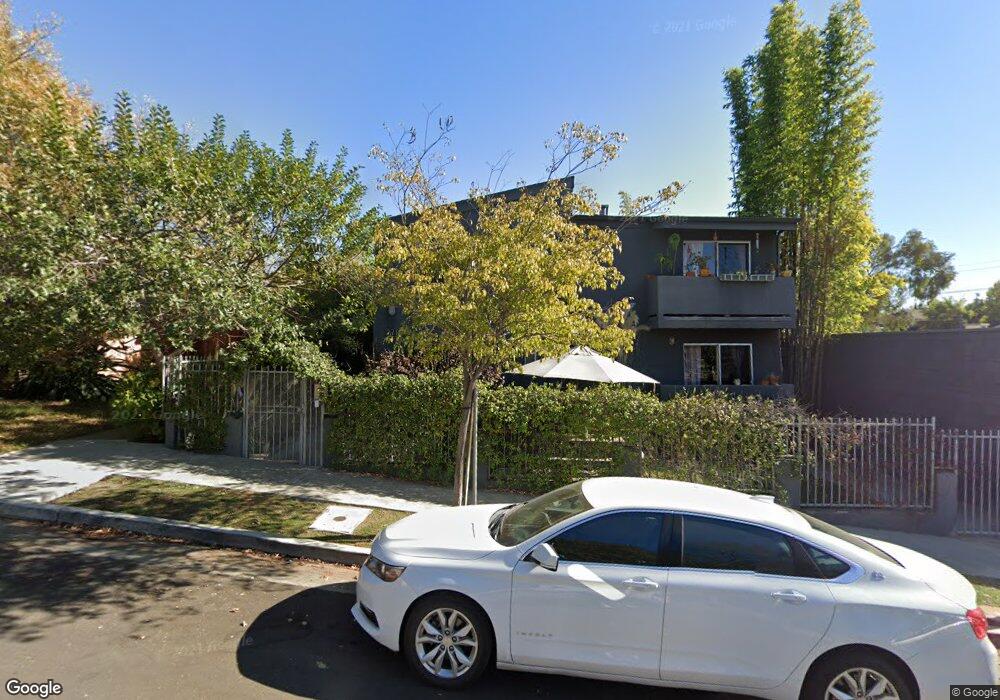
2714 Auburn St Unit 102 Los Angeles, CA 90039
Estimated Value: $727,000 - $1,002,000
3
Beds
2
Baths
1,070
Sq Ft
$811/Sq Ft
Est. Value
About This Home
This home is located at 2714 Auburn St Unit 102, Los Angeles, CA 90039 and is currently estimated at $867,261, approximately $810 per square foot. 2714 Auburn St Unit 102 is a home located in Los Angeles County with nearby schools including Ivanhoe Elementary, Thomas Starr King Middle School Film and Media Magnet, and John Marshall Senior High.
Ownership History
Date
Name
Owned For
Owner Type
Purchase Details
Closed on
Aug 28, 2020
Sold by
Dorcean Alex Donald
Bought by
Mehta Amruta Bipin
Current Estimated Value
Purchase Details
Closed on
Jan 18, 2019
Sold by
Williams Gregory Scott
Bought by
Mehta Amruta Bipin and Dorcean Alex Donald
Home Financials for this Owner
Home Financials are based on the most recent Mortgage that was taken out on this home.
Original Mortgage
$541,300
Outstanding Balance
$474,942
Interest Rate
4.5%
Mortgage Type
New Conventional
Estimated Equity
$392,319
Purchase Details
Closed on
Jan 14, 2008
Sold by
Heisen Christopher and Sohn Nicole M
Bought by
Williams Gregory Scott
Home Financials for this Owner
Home Financials are based on the most recent Mortgage that was taken out on this home.
Original Mortgage
$424,000
Interest Rate
6.25%
Mortgage Type
Purchase Money Mortgage
Create a Home Valuation Report for This Property
The Home Valuation Report is an in-depth analysis detailing your home's value as well as a comparison with similar homes in the area
Home Values in the Area
Average Home Value in this Area
Purchase History
| Date | Buyer | Sale Price | Title Company |
|---|---|---|---|
| Mehta Amruta Bipin | -- | None Listed On Document | |
| Mehta Amruta Bipin | $677,000 | Old Republic Title Co | |
| Williams Gregory Scott | $530,000 | Chicago Title Subdivision |
Source: Public Records
Mortgage History
| Date | Status | Borrower | Loan Amount |
|---|---|---|---|
| Open | Mehta Amruta Bipin | $541,300 | |
| Previous Owner | Williams Gregory Scott | $424,000 |
Source: Public Records
Tax History Compared to Growth
Tax History
| Year | Tax Paid | Tax Assessment Tax Assessment Total Assessment is a certain percentage of the fair market value that is determined by local assessors to be the total taxable value of land and additions on the property. | Land | Improvement |
|---|---|---|---|---|
| 2025 | $9,012 | $754,868 | $562,443 | $192,425 |
| 2024 | $9,012 | $740,067 | $551,415 | $188,652 |
| 2023 | $8,834 | $725,556 | $540,603 | $184,953 |
| 2022 | $8,415 | $711,330 | $530,003 | $181,327 |
| 2021 | $8,309 | $697,383 | $519,611 | $177,772 |
| 2020 | $8,392 | $690,234 | $514,284 | $175,950 |
| 2019 | $630 | $624,063 | $494,544 | $129,519 |
| 2018 | $7,484 | $611,828 | $484,848 | $126,980 |
| 2016 | $7,153 | $588,072 | $466,022 | $122,050 |
| 2015 | $7,048 | $579,239 | $459,022 | $120,217 |
| 2014 | $7,072 | $567,894 | $450,031 | $117,863 |
Source: Public Records
Map
Nearby Homes
- 2811 Waverly Dr
- 2829 Waverly Dr
- 2528 Kenilworth Ave
- 2824 1/2 Avenel St
- 2822 Avenel St
- 2635 Rokeby St
- 2753 Waverly Dr Unit 1003
- 2753 Waverly Dr Unit 705
- 2753 Waverly Dr Unit 1102
- 2753 Waverly Dr Unit 1103
- 2753 Waverly Dr Unit 506
- 2616 Rokeby St
- 2536 Micheltorena St
- 3410 Greensward Rd
- 3414 Greensward Rd
- 2923 Acresite St
- 2401 Meadow Valley Terrace
- 2305 Kenilworth Ave
- 2264 Moreno Dr
- 3775 Aloha St
- 2714 Auburn St Unit 5
- 2714 Auburn St Unit 6
- 2714 Auburn St Unit 4
- 2714 Auburn St Unit 3
- 2714 Auburn St Unit 2
- 2714 Auburn St Unit 1
- 2714 Auburn St Unit 201
- 2714 Auburn St Unit 101
- 2714 Auburn St Unit 202
- 2714 Auburn St Unit 203
- 2714 Auburn St Unit 103
- 2718 Auburn St
- 2722 Auburn St
- 2724 Auburn St
- 2841 Rowena Ave
- 2722 1/2 Auburn St
- 2728 Auburn St
- 2726 Auburn St
- 2730 Auburn St
- 2732 Auburn St Unit 1