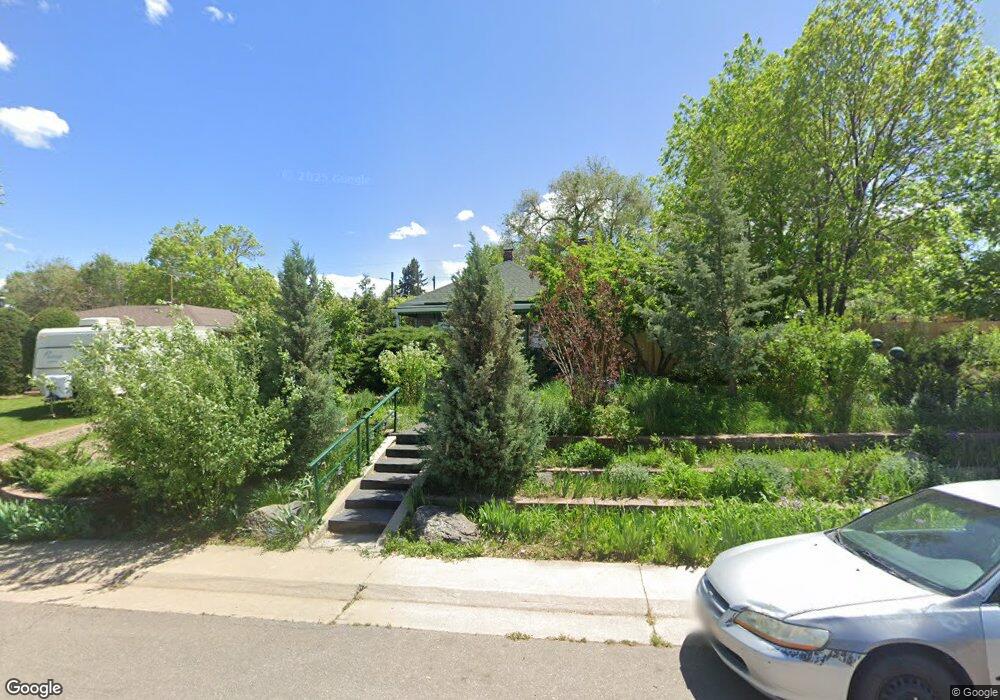
2714 W Irvington Place Denver, CO 80219
Valverde NeighborhoodEstimated Value: $420,000 - $485,000
2
Beds
2
Baths
1,151
Sq Ft
$391/Sq Ft
Est. Value
About This Home
This home is located at 2714 W Irvington Place, Denver, CO 80219 and is currently estimated at $449,619, approximately $390 per square foot. 2714 W Irvington Place is a home located in Denver County with nearby schools including Barnum Elementary School, Kepner Beacon Middle School, and West High School.
Ownership History
Date
Name
Owned For
Owner Type
Purchase Details
Closed on
Jul 28, 2006
Sold by
Contreras Jenny B
Bought by
Potts Paul E
Current Estimated Value
Home Financials for this Owner
Home Financials are based on the most recent Mortgage that was taken out on this home.
Original Mortgage
$177,219
Outstanding Balance
$105,820
Interest Rate
6.66%
Mortgage Type
FHA
Estimated Equity
$343,799
Purchase Details
Closed on
Sep 30, 2002
Sold by
Sullivan Jenny B
Bought by
Contreras Jenny B
Home Financials for this Owner
Home Financials are based on the most recent Mortgage that was taken out on this home.
Original Mortgage
$154,400
Interest Rate
6.09%
Purchase Details
Closed on
Dec 10, 1999
Sold by
Minne Harold L
Bought by
Sullivan Jenny B
Home Financials for this Owner
Home Financials are based on the most recent Mortgage that was taken out on this home.
Original Mortgage
$120,000
Interest Rate
7.95%
Create a Home Valuation Report for This Property
The Home Valuation Report is an in-depth analysis detailing your home's value as well as a comparison with similar homes in the area
Home Values in the Area
Average Home Value in this Area
Purchase History
| Date | Buyer | Sale Price | Title Company |
|---|---|---|---|
| Potts Paul E | $180,000 | Land Title | |
| Contreras Jenny B | -- | -- | |
| Sullivan Jenny B | $150,000 | Land Title |
Source: Public Records
Mortgage History
| Date | Status | Borrower | Loan Amount |
|---|---|---|---|
| Open | Potts Paul E | $177,219 | |
| Previous Owner | Contreras Jenny B | $154,400 | |
| Previous Owner | Sullivan Jenny B | $120,000 |
Source: Public Records
Tax History Compared to Growth
Tax History
| Year | Tax Paid | Tax Assessment Tax Assessment Total Assessment is a certain percentage of the fair market value that is determined by local assessors to be the total taxable value of land and additions on the property. | Land | Improvement |
|---|---|---|---|---|
| 2024 | $2,241 | $28,290 | $10,290 | $18,000 |
| 2023 | $2,192 | $28,290 | $10,290 | $18,000 |
| 2022 | $1,784 | $22,430 | $13,050 | $9,380 |
| 2021 | $1,721 | $23,070 | $13,420 | $9,650 |
| 2020 | $1,684 | $22,700 | $11,190 | $11,510 |
| 2019 | $1,637 | $22,700 | $11,190 | $11,510 |
| 2018 | $1,094 | $14,140 | $9,010 | $5,130 |
| 2017 | $1,091 | $14,140 | $9,010 | $5,130 |
| 2016 | $857 | $10,510 | $7,474 | $3,036 |
| 2015 | $821 | $10,510 | $7,474 | $3,036 |
| 2014 | $623 | $7,500 | $4,155 | $3,345 |
Source: Public Records
Map
Nearby Homes
- 2732 W Archer Place
- 2726 W 1st Ave
- 2658 W 1st Ave
- 2823 W Archer Place
- 118 S Dale Ct
- 175 S Eliot St
- 222 S Canosa Ct
- 3130 W Bayaud Ave
- 2915 W 4th Ave
- 112 S Hooker St
- 257 Hazel Ct
- 10 S Irving St
- 326 S Alcott St
- 107 Irving St
- 360 S Bryant St
- 384 S Decatur St
- 3300 W 2nd Ave
- 44 Julian St
- 217 Irving St
- 160 Julian St
- 2700 W Irvington Place
- 2718 W Irvington Place
- 2719 W Irvington Place
- 2713 W Irvington Place
- 49 Bryant Way
- 2701 W Irvington Place
- 2707 W Ellsworth Ave
- 2729 W Irvington Place
- 2711 W Ellsworth Ave
- 2701 W Ellsworth Ave
- 2732 W Irvington Place
- 2715 W Ellsworth Ave
- 2745 W Irvington Place
- 2733 W Ellsworth Ave
- 45 Bryant Way
- 2748 W Irvington Place
- 50 Bryant Way
- 2695 W Ellsworth Ave
- 2753 W Irvington Place
- 2735 W Ellsworth Ave