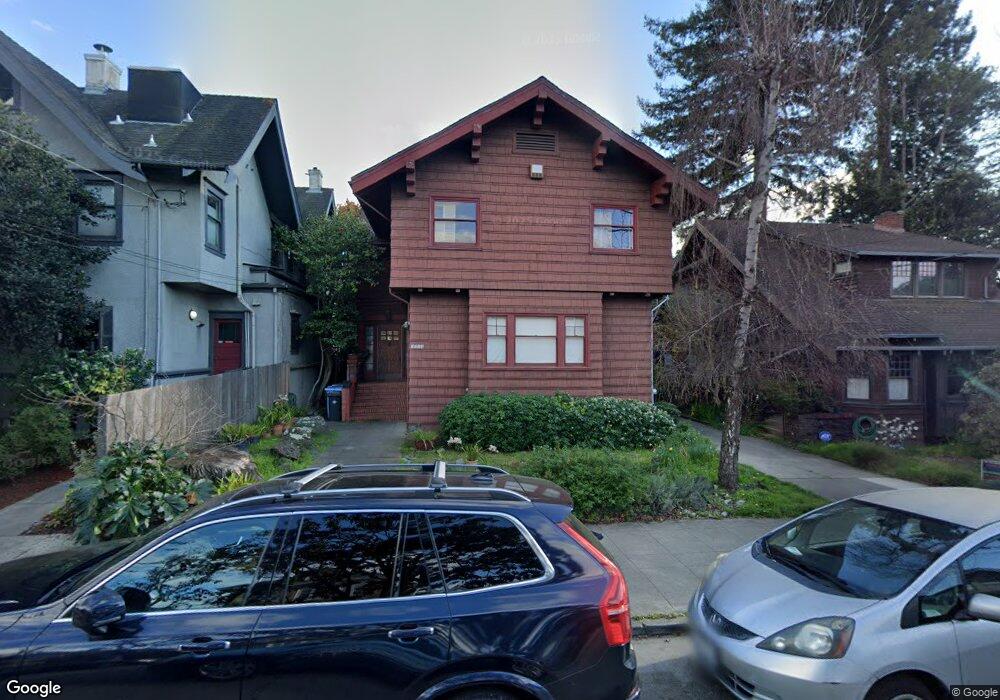
2714 Woolsey St Berkeley, CA 94705
Elmwood NeighborhoodEstimated Value: $2,063,992 - $2,967,000
3
Beds
4
Baths
2,198
Sq Ft
$1,124/Sq Ft
Est. Value
About This Home
This home is located at 2714 Woolsey St, Berkeley, CA 94705 and is currently estimated at $2,470,748, approximately $1,124 per square foot. 2714 Woolsey St is a home located in Alameda County with nearby schools including John Muir Elementary School, Emerson Elementary School, and Malcolm X Elementary School.
Ownership History
Date
Name
Owned For
Owner Type
Purchase Details
Closed on
Mar 21, 2011
Sold by
Harris Joanna G
Bought by
Harris Joanna G
Current Estimated Value
Home Financials for this Owner
Home Financials are based on the most recent Mortgage that was taken out on this home.
Original Mortgage
$938,250
Interest Rate
2.75%
Mortgage Type
Reverse Mortgage Home Equity Conversion Mortgage
Purchase Details
Closed on
Dec 20, 2005
Sold by
Harris Joanna
Bought by
Harris Joanna G and The Joanna G Harris Revocable
Home Financials for this Owner
Home Financials are based on the most recent Mortgage that was taken out on this home.
Original Mortgage
$164,650
Interest Rate
6.36%
Mortgage Type
New Conventional
Purchase Details
Closed on
Jun 15, 2004
Sold by
Harris Joanna G
Bought by
Harris Joanna G and Joanna G Harris Revocable Trus
Create a Home Valuation Report for This Property
The Home Valuation Report is an in-depth analysis detailing your home's value as well as a comparison with similar homes in the area
Home Values in the Area
Average Home Value in this Area
Purchase History
| Date | Buyer | Sale Price | Title Company |
|---|---|---|---|
| Harris Joanna G | -- | Placer Title Company | |
| Harris Joanna G | -- | Placer Title Company | |
| Harris Joanna | -- | Placer Title Company | |
| Harris Joanna G | -- | -- |
Source: Public Records
Mortgage History
| Date | Status | Borrower | Loan Amount |
|---|---|---|---|
| Closed | Harris Joanna G | $938,250 | |
| Closed | Harris Joanna | $164,650 |
Source: Public Records
Tax History
| Year | Tax Paid | Tax Assessment Tax Assessment Total Assessment is a certain percentage of the fair market value that is determined by local assessors to be the total taxable value of land and additions on the property. | Land | Improvement |
|---|---|---|---|---|
| 2025 | $6,431 | $139,284 | $87,526 | $58,758 |
| 2024 | $6,431 | $136,416 | $85,810 | $57,606 |
| 2023 | $6,200 | $140,603 | $84,127 | $56,476 |
| 2022 | $5,938 | $130,847 | $82,478 | $55,369 |
| 2021 | $5,893 | $128,145 | $80,861 | $54,284 |
| 2020 | $5,379 | $133,759 | $80,032 | $53,727 |
| 2019 | $4,942 | $131,137 | $78,463 | $52,674 |
| 2018 | $4,794 | $128,566 | $76,925 | $51,641 |
| 2017 | $4,598 | $126,045 | $75,416 | $50,629 |
| 2016 | $4,283 | $123,574 | $73,938 | $49,636 |
| 2015 | $4,193 | $121,717 | $72,827 | $48,890 |
| 2014 | $4,090 | $119,334 | $71,401 | $47,933 |
Source: Public Records
Map
Nearby Homes
- 2477 Prince St
- 6446 Colby St
- 2935 Florence St
- 6100 Chabot Rd
- 2643 Stuart St
- 2817 Palm Ct
- 6445 Irwin Ct
- 2243 Ashby Ave
- 556 Alcatraz Ave
- 5941 Keith Ave
- 204 El Camino Real
- 2632 Warring St Unit 3
- 5936 Broadway
- 629 66th St
- 2702 Dana St
- 2611 Piedmont Ave Unit 4
- 2319 Ward St
- 2601 College Ave Unit 203
- 2601 College Ave Unit 208
- 2923 Wheeler St
- 3100 Lewiston Ave
- 2710 Woolsey St
- 3108 Lewiston Ave
- 3112 Lewiston Ave
- 3103 College Ave
- 2700 Woolsey St
- 3105 College Ave
- 3107 Lewiston Ave
- 3111 College Ave Unit C
- 3111 College Ave Unit A
- 3111 College Ave Unit B
- 2715 Woolsey St
- 3109 College Ave Unit C
- 3109 College Ave Unit B
- 3109 College Ave Unit A
- 2713 Woolsey St
- 3116 Lewiston Ave
- 2719 Woolsey St
- 2709 Woolsey St
- 3109 Lewiston Ave
Your Personal Tour Guide
Ask me questions while you tour the home.