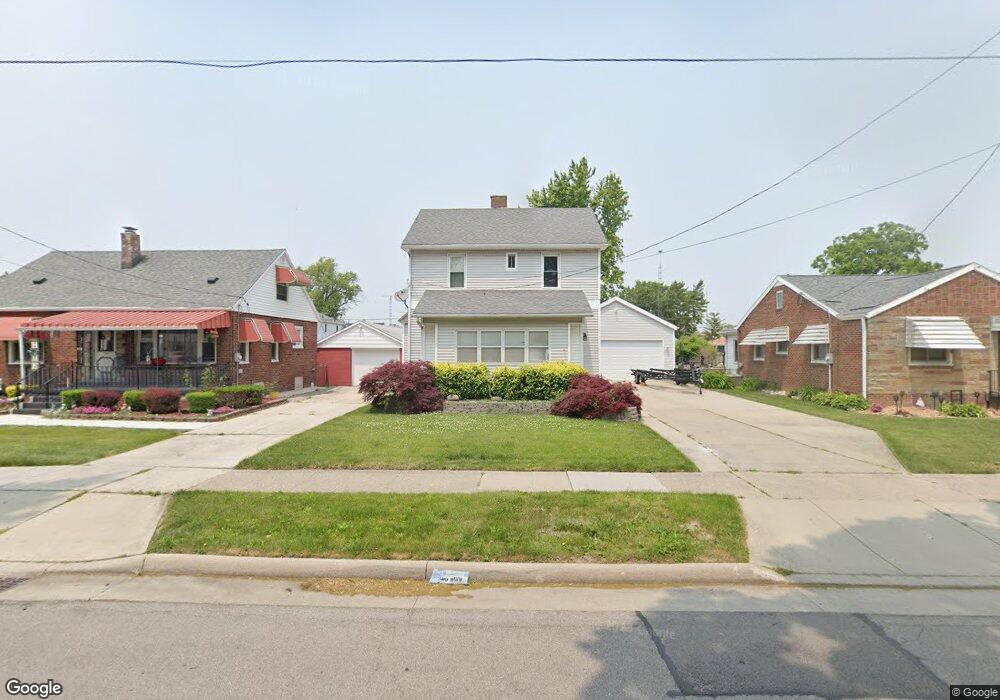
2715 109th St Toledo, OH 43611
Point Place NeighborhoodEstimated Value: $149,966 - $171,000
3
Beds
1
Bath
1,206
Sq Ft
$134/Sq Ft
Est. Value
About This Home
This home is located at 2715 109th St, Toledo, OH 43611 and is currently estimated at $161,242, approximately $133 per square foot. 2715 109th St is a home located in Lucas County with nearby schools including Ottawa River Elementary School, Woodward High School, and Imagine Environmental Science Academy.
Ownership History
Date
Name
Owned For
Owner Type
Purchase Details
Closed on
Oct 31, 2025
Sold by
Sheckler Michael and Sheckler Mike
Bought by
Traux Christopher
Current Estimated Value
Home Financials for this Owner
Home Financials are based on the most recent Mortgage that was taken out on this home.
Original Mortgage
$114,300
Outstanding Balance
$114,300
Interest Rate
6.34%
Mortgage Type
VA
Estimated Equity
$46,942
Purchase Details
Closed on
Mar 30, 2018
Sold by
Truax John G
Bought by
Sheckler Mike
Home Financials for this Owner
Home Financials are based on the most recent Mortgage that was taken out on this home.
Original Mortgage
$77,000
Interest Rate
4.38%
Mortgage Type
VA
Purchase Details
Closed on
Jun 4, 2009
Sold by
Truax John G and Truax Laura M
Bought by
Truax John G
Purchase Details
Closed on
Nov 4, 2003
Sold by
Kalinowski David and Kalinowski Linda
Bought by
Truax John G and Truax Laura M
Purchase Details
Closed on
Jun 27, 1989
Sold by
Sparks Gertrude E
Create a Home Valuation Report for This Property
The Home Valuation Report is an in-depth analysis detailing your home's value as well as a comparison with similar homes in the area
Home Values in the Area
Average Home Value in this Area
Purchase History
| Date | Buyer | Sale Price | Title Company |
|---|---|---|---|
| Traux Christopher | $114,300 | Navy Federal Title Services Ll | |
| Sheckler Mike | $80,000 | Area Title Agency Inc | |
| Truax John G | -- | Attorney | |
| Truax John G | $45,000 | -- | |
| -- | $42,000 | -- |
Source: Public Records
Mortgage History
| Date | Status | Borrower | Loan Amount |
|---|---|---|---|
| Open | Traux Christopher | $114,300 | |
| Previous Owner | Sheckler Mike | $77,000 |
Source: Public Records
Tax History Compared to Growth
Tax History
| Year | Tax Paid | Tax Assessment Tax Assessment Total Assessment is a certain percentage of the fair market value that is determined by local assessors to be the total taxable value of land and additions on the property. | Land | Improvement |
|---|---|---|---|---|
| 2024 | $1,219 | $40,005 | $7,105 | $32,900 |
| 2023 | $2,070 | $32,340 | $6,440 | $25,900 |
| 2022 | $2,072 | $32,340 | $6,440 | $25,900 |
| 2021 | $2,121 | $32,340 | $6,440 | $25,900 |
| 2020 | $1,982 | $26,530 | $5,285 | $21,245 |
| 2019 | $1,927 | $26,530 | $5,285 | $21,245 |
| 2018 | $1,834 | $26,530 | $5,285 | $21,245 |
| 2017 | $1,746 | $22,575 | $6,370 | $16,205 |
| 2016 | $1,747 | $64,500 | $18,200 | $46,300 |
| 2015 | $1,732 | $64,500 | $18,200 | $46,300 |
| 2014 | $1,420 | $22,580 | $6,370 | $16,210 |
| 2013 | $1,420 | $22,580 | $6,370 | $16,210 |
Source: Public Records
Map
Nearby Homes