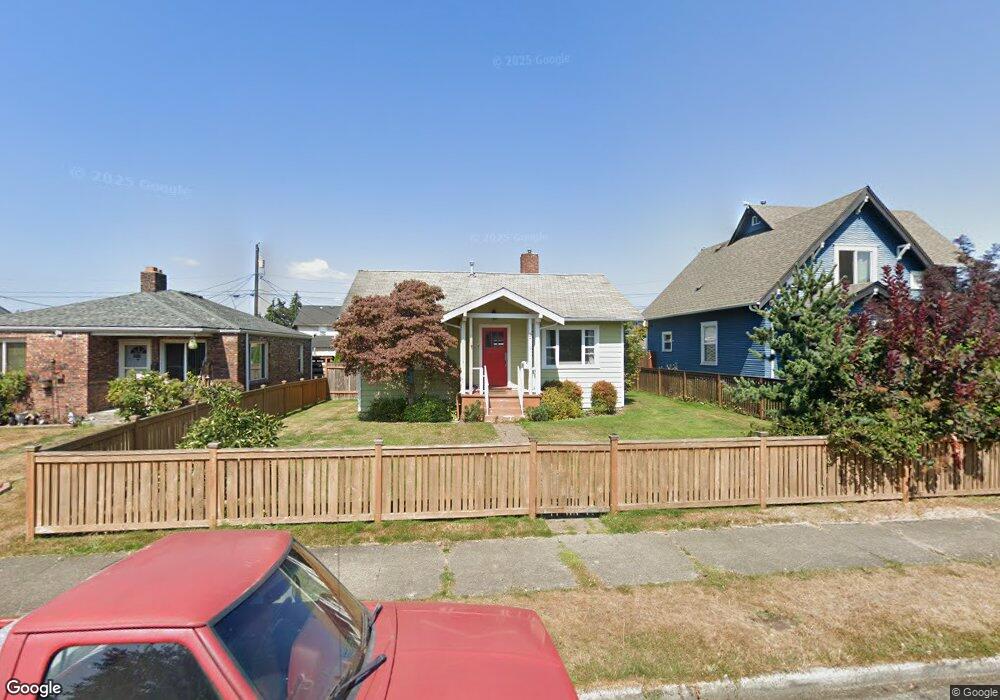
2715 21st St Everett, WA 98201
Riverside NeighborhoodEstimated Value: $466,000 - $554,800
2
Beds
2
Baths
942
Sq Ft
$551/Sq Ft
Est. Value
About This Home
This home is located at 2715 21st St, Everett, WA 98201 and is currently estimated at $519,450, approximately $551 per square foot. 2715 21st St is a home located in Snohomish County with nearby schools including Garfield Elementary School, North Middle School, and Everett High School.
Ownership History
Date
Name
Owned For
Owner Type
Purchase Details
Closed on
Feb 26, 2020
Sold by
Hedges Jessica and Simonson Brian
Bought by
Simonson Brian J and Simonson Jessica M
Current Estimated Value
Home Financials for this Owner
Home Financials are based on the most recent Mortgage that was taken out on this home.
Original Mortgage
$201,666
Outstanding Balance
$178,941
Interest Rate
3.6%
Mortgage Type
New Conventional
Estimated Equity
$340,509
Purchase Details
Closed on
Sep 7, 2007
Sold by
Kleweno Troy
Bought by
Hedges Jessica and Simonson Brian
Home Financials for this Owner
Home Financials are based on the most recent Mortgage that was taken out on this home.
Original Mortgage
$49,980
Interest Rate
6.29%
Mortgage Type
Stand Alone Second
Purchase Details
Closed on
Oct 16, 1995
Sold by
Ogilvie Joanne M and Ogilvie Johanna M
Bought by
Ogilvie Fredric R
Create a Home Valuation Report for This Property
The Home Valuation Report is an in-depth analysis detailing your home's value as well as a comparison with similar homes in the area
Home Values in the Area
Average Home Value in this Area
Purchase History
| Date | Buyer | Sale Price | Title Company |
|---|---|---|---|
| Simonson Brian J | -- | Cw Title | |
| Hedges Jessica | $249,900 | Ticor Title Company | |
| Ogilvie Fredric R | -- | -- |
Source: Public Records
Mortgage History
| Date | Status | Borrower | Loan Amount |
|---|---|---|---|
| Open | Simonson Brian J | $201,666 | |
| Closed | Hedges Jessica | $49,980 | |
| Closed | Hedges Jessica | $199,920 |
Source: Public Records
Tax History
| Year | Tax Paid | Tax Assessment Tax Assessment Total Assessment is a certain percentage of the fair market value that is determined by local assessors to be the total taxable value of land and additions on the property. | Land | Improvement |
|---|---|---|---|---|
| 2025 | $4,127 | $506,200 | $330,000 | $176,200 |
| 2024 | $4,127 | $480,600 | $305,000 | $175,600 |
| 2023 | $3,975 | $484,100 | $310,000 | $174,100 |
| 2022 | $3,555 | $388,300 | $239,000 | $149,300 |
| 2020 | $3,571 | $318,100 | $189,000 | $129,100 |
| 2019 | $3,158 | $283,100 | $156,000 | $127,100 |
| 2018 | $3,098 | $254,600 | $140,000 | $114,600 |
| 2017 | $2,871 | $235,000 | $127,000 | $108,000 |
| 2016 | $2,466 | $212,200 | $108,000 | $104,200 |
Source: Public Records
Map
Nearby Homes
- 2130 Virginia Ave
- 2221 Virginia Ave
- 2005 Mcdougall Ave
- 3015 Victor Place
- 2707 18th St
- 1721 Cedar St
- 1717 Cedar St
- 2002 State St Unit C
- 1920 Broadway
- 1721 Mcdougall Ave
- 2009 Lombard Ave
- 1621 Baker Ave
- 1925 Lombard Ave Unit A
- 1925 Lombard Ave Unit A,B,C
- 2432 Pine St Unit A
- 2120 Highland Ave Unit 105
- 1601 Virginia Ave
- 1523 Virginia Ave
- 2108 Summit Ave Unit 3
- 3510 19th St
Your Personal Tour Guide
Ask me questions while you tour the home.