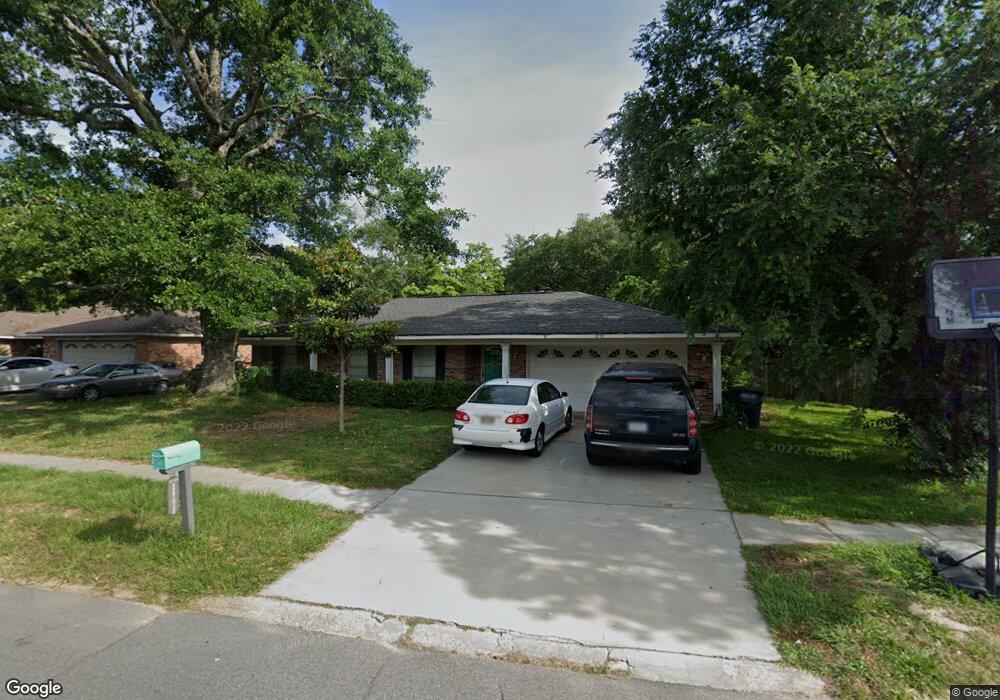
2715 Walton Dr Ocean Springs, MS 39564
Estimated Value: $287,963 - $334,000
4
Beds
2
Baths
1,850
Sq Ft
$165/Sq Ft
Est. Value
About This Home
This home is located at 2715 Walton Dr, Ocean Springs, MS 39564 and is currently estimated at $305,991, approximately $165 per square foot. 2715 Walton Dr is a home located in Jackson County with nearby schools including Pecan Park Elementary School, Ocean Springs Middle School, and Ocean Springs High School.
Ownership History
Date
Name
Owned For
Owner Type
Purchase Details
Closed on
Jan 21, 2011
Sold by
Caesar Llc
Bought by
Robinson Gary A
Current Estimated Value
Home Financials for this Owner
Home Financials are based on the most recent Mortgage that was taken out on this home.
Original Mortgage
$22,500
Interest Rate
4.79%
Purchase Details
Closed on
Oct 13, 2010
Sold by
Secretary Of Housing And Urban Developme
Bought by
Ceasar Llc
Purchase Details
Closed on
May 5, 2010
Sold by
Everhome Mortgage Company
Bought by
Secretary Of Housing And Urban Developme
Purchase Details
Closed on
Nov 5, 2005
Sold by
Wallette Elizabeth
Bought by
Andrews Steven
Home Financials for this Owner
Home Financials are based on the most recent Mortgage that was taken out on this home.
Original Mortgage
$166,388
Interest Rate
6.23%
Create a Home Valuation Report for This Property
The Home Valuation Report is an in-depth analysis detailing your home's value as well as a comparison with similar homes in the area
Home Values in the Area
Average Home Value in this Area
Purchase History
| Date | Buyer | Sale Price | Title Company |
|---|---|---|---|
| Robinson Gary A | -- | -- | |
| Ceasar Llc | -- | Luckett Land Title Inc | |
| Secretary Of Housing And Urban Developme | -- | -- | |
| Andrews Steven | -- | -- |
Source: Public Records
Mortgage History
| Date | Status | Borrower | Loan Amount |
|---|---|---|---|
| Closed | Robinson Gary A | $22,500 | |
| Previous Owner | Andrews Steven | $166,388 |
Source: Public Records
Tax History Compared to Growth
Tax History
| Year | Tax Paid | Tax Assessment Tax Assessment Total Assessment is a certain percentage of the fair market value that is determined by local assessors to be the total taxable value of land and additions on the property. | Land | Improvement |
|---|---|---|---|---|
| 2024 | $1,787 | $14,482 | $2,707 | $11,775 |
| 2023 | $1,787 | $14,482 | $2,707 | $11,775 |
| 2022 | $1,815 | $14,482 | $2,707 | $11,775 |
| 2021 | $1,795 | $14,549 | $2,707 | $11,842 |
| 2020 | $1,493 | $12,328 | $2,011 | $10,317 |
| 2019 | $1,486 | $12,328 | $2,011 | $10,317 |
| 2018 | $1,477 | $12,328 | $2,011 | $10,317 |
| 2017 | $1,477 | $12,328 | $2,011 | $10,317 |
| 2016 | $1,440 | $12,328 | $2,011 | $10,317 |
| 2015 | $1,293 | $110,710 | $20,110 | $90,600 |
| 2014 | $1,271 | $11,004 | $2,011 | $8,993 |
| 2013 | $1,236 | $11,004 | $2,011 | $8,993 |
Source: Public Records
Map
Nearby Homes
- 2550 Davidson Rd
- 11 Royal Dr
- 2715 Hargrove Dr
- 407 Holly St
- 2909 Pimlico Dr
- 229 Woodland Cir
- 1066 Conley Cir
- 242 Woodland Cir
- 311 Teringo Cir
- 148 Lafayette Cir
- 229 Linda Dr
- 133 Seaside Dr
- 208 Wheaton Ct
- 211 Barbara Cir
- 272 Holcomb Blvd
- 288 Mc Cool St
- 100 Hunter Dr
- 205 Walnut Dr
- 0 North St
- 121 Beverly Dr
- 2713 Walton Dr
- 2717 Walton Dr
- 2714 English Dr
- 2712 English Dr
- 100 Winchester Dr
- 2711 Walton Dr
- 2716 English Dr
- 2714 Walton Dr
- 2719 Walton Dr
- 100 Winchester Ct
- 2710 English Dr
- 2712 Walton Dr
- 2718 Walton Dr
- 2721 Walton Dr
- 2709 Walton Dr
- 0 Walton Dr
- 2710 Walton Dr
- 2708 English Dr
- 102 Winchester Dr
- 102 Winchester Ct